FIGURE 9.
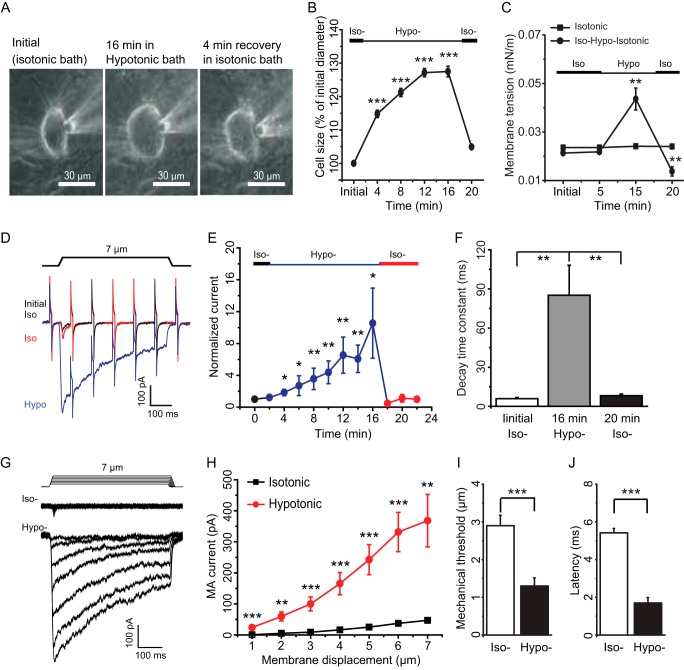
Osmotic swelling, static plasma membrane tension, and RA-MA currents can be rapidly reversed in isotonic condition. A, images show osmotic swelling of a DRG neuron by extracellular application of a hypotonic solution (220 mosm). Left, in isotonic bath; middle, following the application of hypotonic solution for 16 min; right, after a 4-min recovery in isotonic bath. B, summary data of the time course of osmotic swelling-induced changes of cell sizes following extracellular hypotonicity and recovery in isotonic solution (black circles, n = 7). C, summary data of the changes of SPMT induced by extracellular hypotonicity (Hypo) and recovery in isotonic solution (Iso) (black circles, n = 7). SPMT was also measured in isotonic solution over the same time period (black squares, n = 7). D, sample traces of RA-MA currents at initial time in isotonic bath (black), 16 min following the extracellular application of hypotonic solution (blue), and following a 4-min recovery in isotonic bath solution (red). E, summary of the increases of RA-MA currents over time from isotonic solution (black, n = 7) and following bath application of hypotonic solution (blue, n = 7) and restoration of RA-MA currents following the bath application of isotonic bath solution (red, n = 7). F, summary data of the decay time constants at initial time in isotonic bath (left, n = 7), 16 min following the application of the hypotonic solution (middle, n = 7), and following a 4-min recovery in isotonic bath solution (right, n = 5). The membrane displacement is 7 μm in E and F. G, sample traces of RA-MA currents evoked by different membrane displacement steps before and following the bath application of hypotonic solution for 16 min. H, summary data of the experiments illustrated in G in isotonic bath (black squares, n = 7) and hypotonic bath (red circles, n = 7). I, mechanical thresholds for evoking RA-MA currents in isotonic bath (open bars, n = 10) and following the application of hypotonic solution for 16 min (solid bars, n = 7). J, latency for RA-MA current onset in isotonic bath solution (open bars, n = 10) and following the application of hypotonic solution for 16 min (solid bars, n = 6). Data represent mean ± S.E., *, p < 0.05; **, p < 0.01; ***, p < 0.001.

