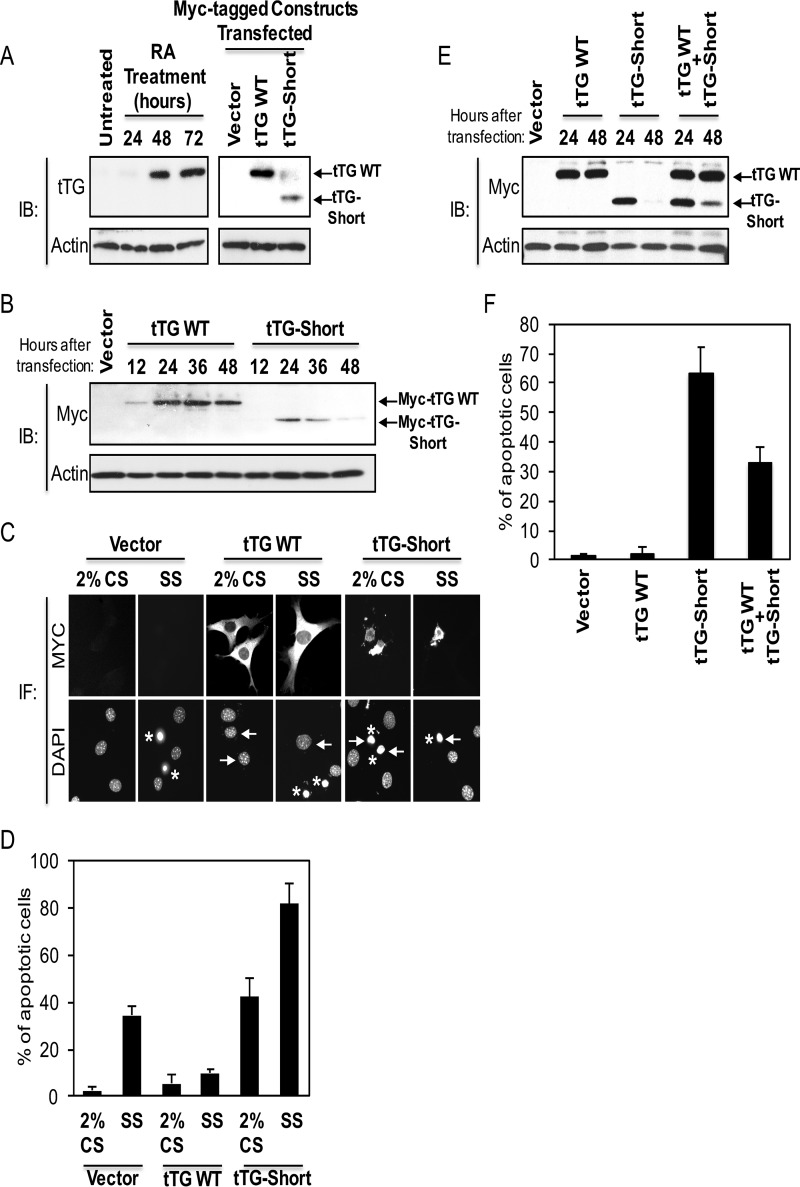
FIGURE 2.
tTG WT and tTG-Short differently influence cell survival. A, cell lysates collected from NIH3T3 fibroblasts that were either treated with RA for the indicated lengths of time (left panels) or ectopically expressing the vector alone, Myc-tagged tTG WT, or Myc-tagged tTG-Short for ∼36 h (right panels) were immunoblotted (IB) with tTG and actin antibodies. B, cell lysates collected from NIH3T3 fibroblasts ectopically expressing either the vector alone for 36 h or Myc-tagged forms of either tTG WT and tTG-Short for the indicated lengths of time were immunoblotted with Myc and actin antibodies. C, NIH3T3 cells ectopically expressing the vector alone, Myc-tagged tTG WT, and Myc-tagged tTG-Short were either cultured in medium containing 2% CS or serum-starved (SS) for ∼36 h and fixed. Immunofluorescence (IF) was performed on the cells using a Myc antibody to detect the transfectants. The cells were also stained with DAPI to label nuclei. Representative images of the transfectants and their nuclei are shown. Arrows highlight the nuclei of a given transfectant, whereas asterisks indicate condensed/blebbed (apoptotic) nuclei. D, the experiment shown in C was performed three separate times, and the percent apoptosis for each condition was determined by calculating the ratio of apoptotic to non-apoptotic cells. The data shown represent the means ± S.E. E, cell lysates collected from NIH3T3 cells ectopically expressing either the vector alone for 48 h or the indicated combinations of Myc-tagged forms of tTG WT and tTG-Short for 24 and 48 h were immunoblotted with Myc and actin antibodies. F, cells ectopically expressing the vector alone, Myc-tagged tTG WT, HA-tagged tTG-Short, or Myc-tagged tTG WT and HA-tagged tTG-Short were cultured in medium containing 2% CS for ∼36 h and fixed. Immunofluorescence was performed on the cells using Myc and HA antibodies to detect the transfectants. The cells were also stained with DAPI to label nuclei. The percent of cells with condensed/blebbed (apoptotic) nuclei for each condition was determined by calculating the ratio of apoptotic to non-apoptotic cells. The experiment was performed three separate times, and the data shown represent mean ± S.E.

