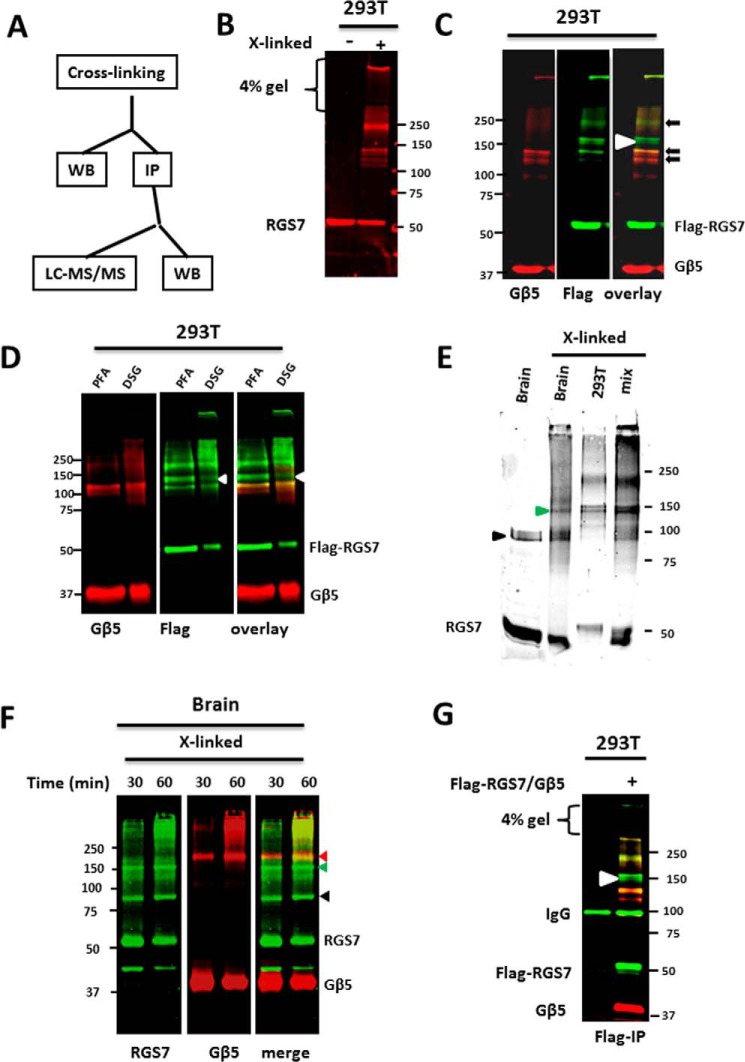
FIGURE 3.
Chemical cross-linking of RGS7 complexes in live cells. A, flow chart representing our cross-linking, Western blot (WB), immunoprecipitation (IP), and mass-spectrometry (LC-MS/MS) experiments. B, HEK293T cells expressing RGS7 and Gβ5 were incubated with 1% PFA for 30 min and analyzed by immunoblot with anti-RGS7 antibodies, as described under “Experimental Procedures.” Left lane shows a representative Western blot of the control cells (untreated with PFA) probed with anti-RGS7 antibody. Right lane, lysate from cells treated with PFA. C, immunoblot analysis of lysates from cells expressing FLAG-RGS7 and Gβ5 probed with antibodies against FLAG (green) and Gβ5 (red). Black arrows indicate the cross-linked complexes containing both RGS7 and Gβ5. White arrowhead at ∼150-kDa denotes an RGS7 complex that does not contain Gβ5. D, HEK293T cells were transfected with FLAG-RGS7 and Gβ5 and cross-linked with either PFA or DSG. The resulting products were analyzed by Western blot to compare the patterns of cross-linked proteins using antibodies against FLAG (green) and Gβ5 (red). E, cross-linking of endogenous RGS7 in mouse brain was done using PFA as described under “Experimental Procedures.” To compare the apparent molecular weight of the cross-linked RGS7 products from brain and transfected HEK293T cells, the samples were resolved on 8% gel. The arrowhead points to the band that is identical in electrophoretic mobility. When the two samples were mixed (mix), the intensity of this band increased. F, mouse brain slices were treated with PFA for 30 or 60 min. The proteins were resolved on a 10% gel and analyzed by Western blot using anti-RGS7 and anti-Gβ5 antibodies. Because both primary antibodies were from rabbit, we used the following method. First, the immunoblot was stained using anti-RGS7 antibodies and scanned using the Odyssey instrument (green). The filter was then stripped and probed with anti-Gβ5 antibodies (red). The two images were merged to compare the exact position of RGS7 and Gβ5-positive bands. Red arrowhead denotes the protein cross-linking product that contains both RGS7 and Gβ5. Green arrowhead points to the 150-kDa RGS7 complex. Black arrowhead shows a nonspecific band revealed by the RGS7 antibody in the brain extracts. G, immunoprecipitation of the cross-linked RGS7 complexes from transfected HEK293T cells using anti-FLAG antibody. The eluates from the beads were analyzed by immunoblot and by mass spectrometry (see text and Table 1). Left lane, lysates from untransfected cells were used as a negative control. Shown are representative immunoblots from three (D, E, and F) or more than five (B, C, and G) independent experiments.

