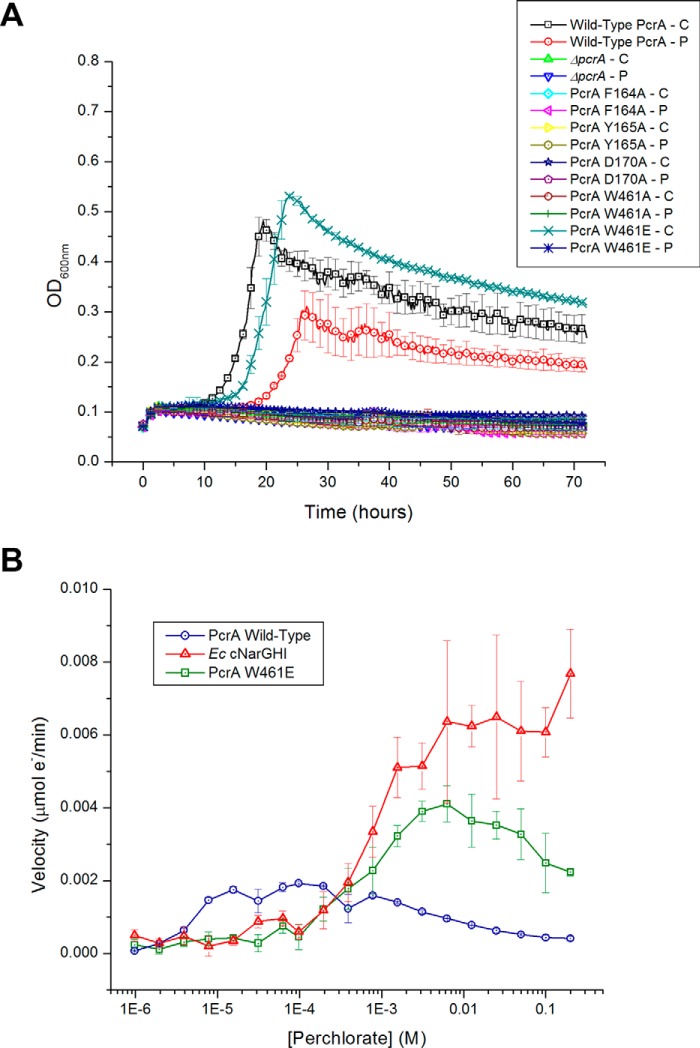
FIGURE 5.
A, growth curves for wild-type A. suillum PS, ΔpcrA, and PcrA mutant strains under perchlorate or chlorate reducing conditions. C is chlorate, and P is perchlorate. Error bars represent one standard deviation of triplicate growth experiments. B, steady-state kinetics of perchlorate reduction by PcrAB containing the PcrA W461E mutation in comparison with wild-type PcrAB and EcNarGHI. Error bars represent one standard deviation of triplicate assays.

