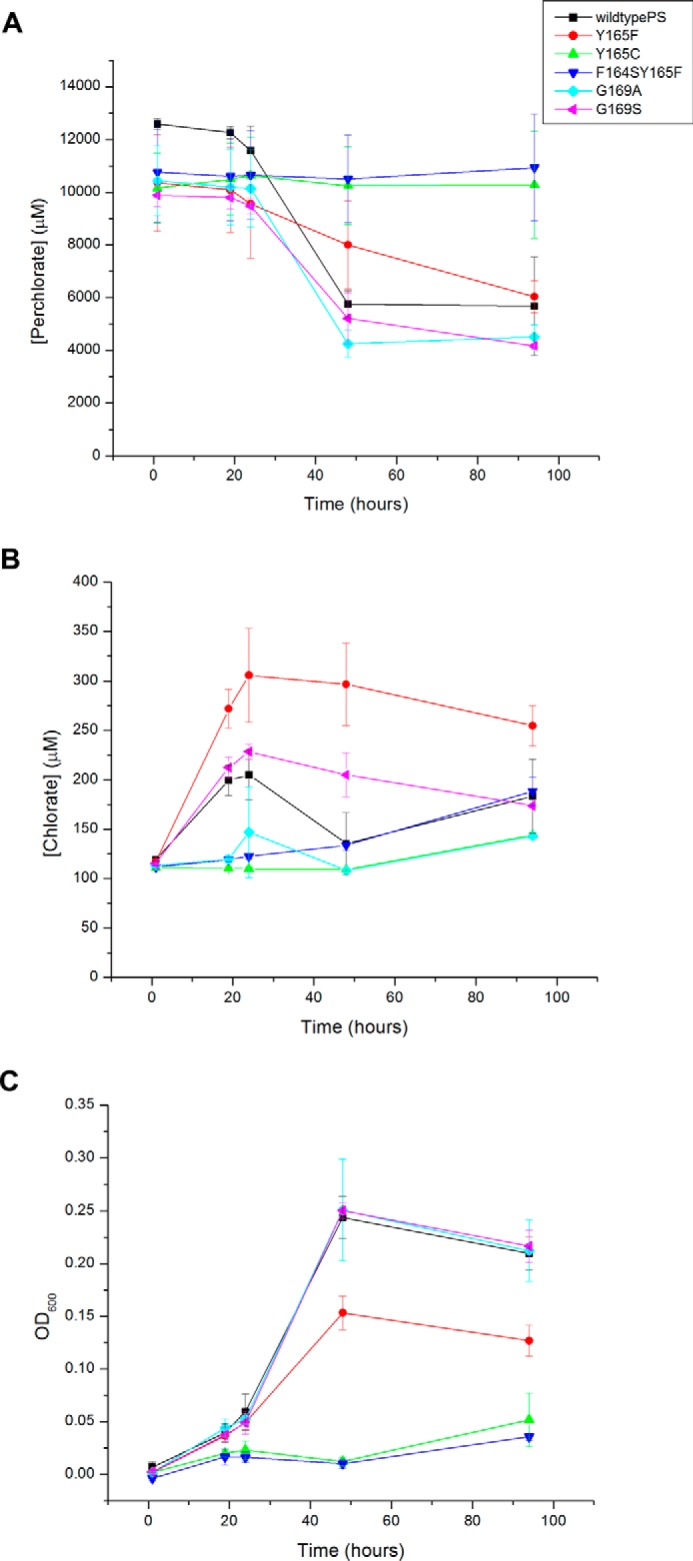
FIGURE 7.

Chlorate accumulation experiments of wild-type A. suillum PS and A. suillum PS cells containing pcrA mutations monitoring chlorate (A), perchlorate (B), and OD600 (C). Error bars represent the standard deviation of three replicate experiments.
