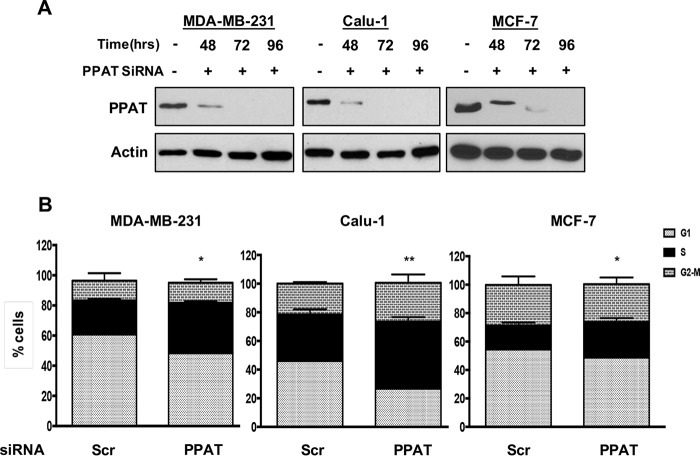
FIGURE 3.
S-phase arrest upon blocking de novo nucleotide biosynthesis pathway. A, MDA-MB-231 and Calu-1 cells were plated at 60% confluence in 6-well plates in CM. After 24 h, cells were transfected with either scrambled (Scr) or PPAT siRNA. Western blot was performed on lysates collected at the indicated time points to check the levels of PPAT. The data shown are representative of experiments repeated two times. B, cells were prepared as in A and then shifted to fresh medium for 96 h. The cells were collected, and flow cytometric analysis was performed for cell cycle distribution by measuring DNA content/cell. The error bars represent S.D. for experiments repeated two times. p values for the S-phase population in MDA-MB-231 and Calu-1 cells, across the samples are expressed relative to control Q (ns, p > 0.05; *, p < 0.05; **, p < 0.01; ***, p < 0.001; ****, p < 0.0001.).

