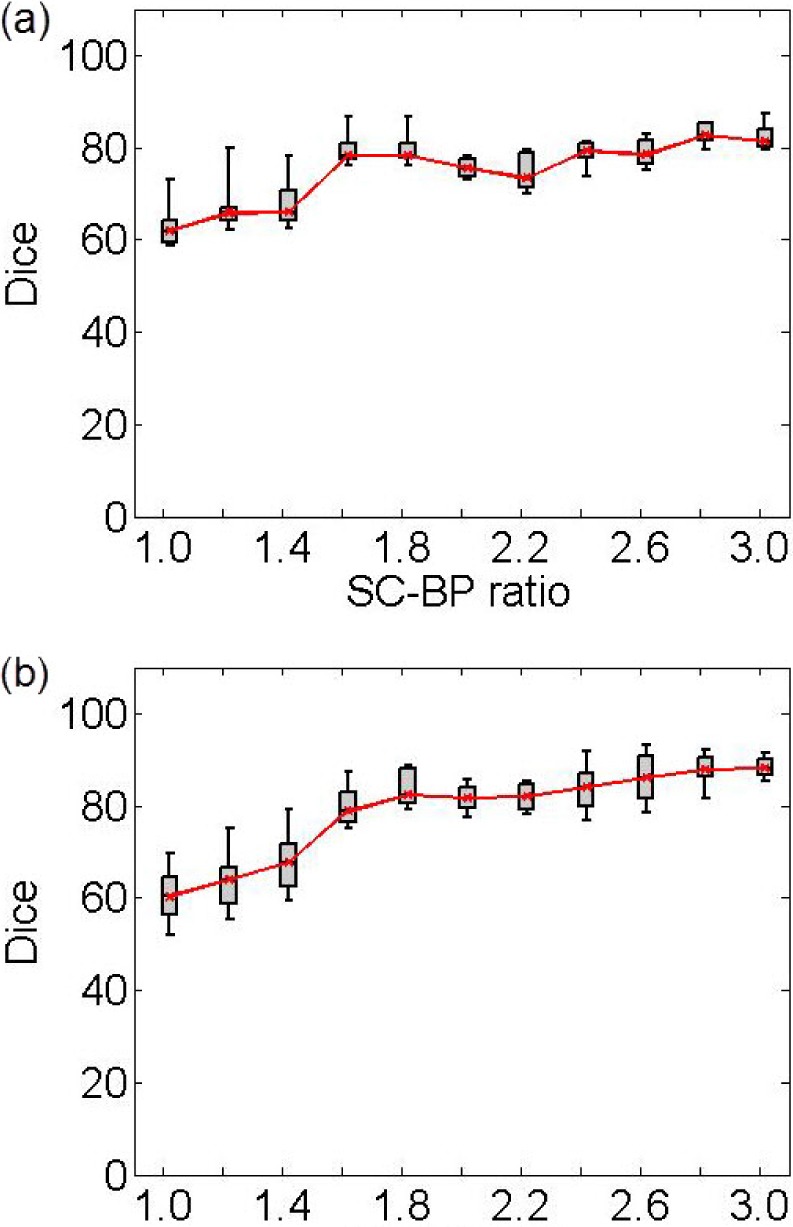
Fig. 6.

Performance of algorithm on numerical phantoms with increasing SC-BP contrast and SNR fixed at 9.0. Each graph is an instance of the algorithm: (a) trained on 1.5 to 1.8, and (b) trained on 1.8 to 2.1. The trend-lines show the median. Boxes in the plot indicate the 9th, 25th, 50th, 75th and 91st percentiles.
