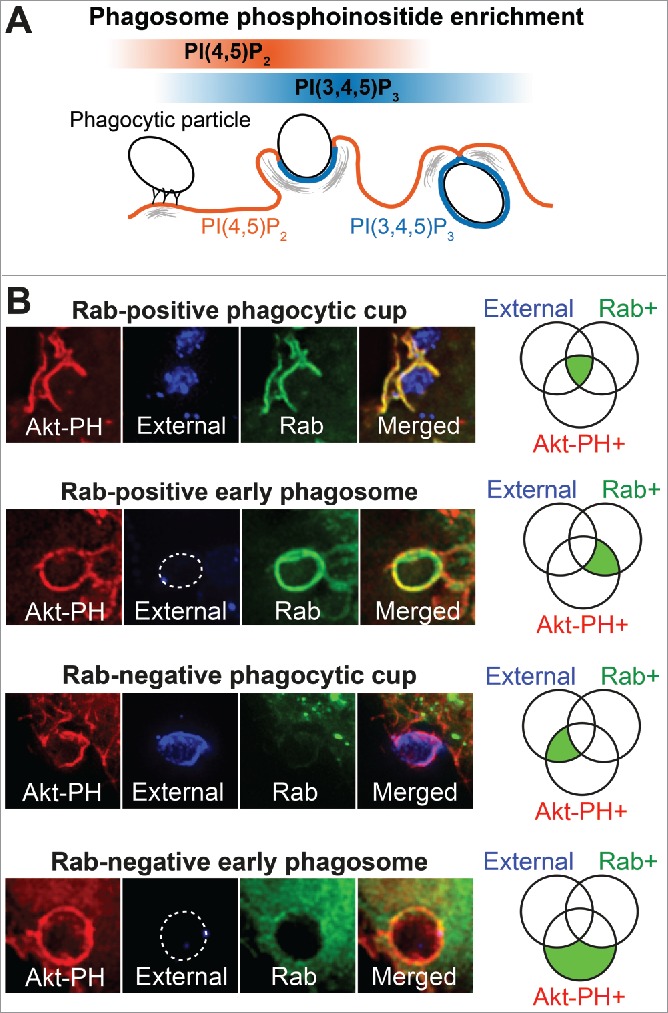
Figure 1.

Defining and measuring early-stage phagocytosis and Rab recruitment (A) Schematic diagram of the progression of FcγR-mediated phagocytosis showing the classical enrichment of PI(4,5)P2 followed by PI(3,4,5)P3 on phagocytic cups and phagosomes. (B) Representative examples of the presence or absence of Rabs on phagocytic cups and phagosomes. Application of an external antibody against IgG-sRBC can distinguish the open phagocytic cup (blue signal in External) from the closed phagosome (loss of blue signal). These parameters correspond to a Venn diagram on the right where percentages of phagosome populations are quantified and classified into their corresponding areas in the Venn diagram (green shadings).
