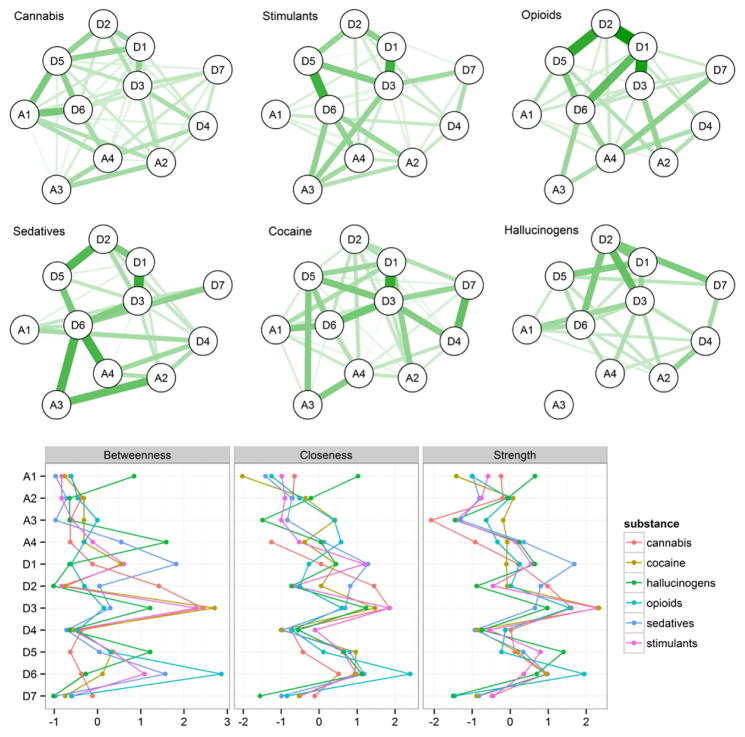
Figure 2.
Symptom networks for individual substances. Upper: Line thickness/darkness indicates the strength of pairwise connections. All six networks use the same graphical standardization, which means that the strength of the edges can be compared across networks. Lower: standardized centrality measures for each symptom within each substance network.

