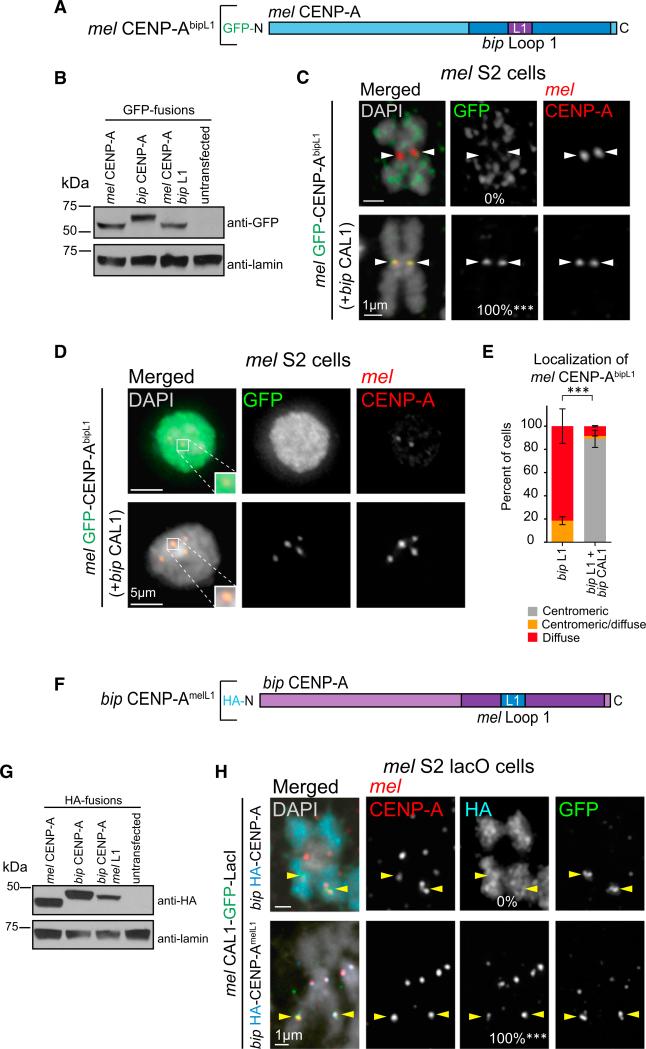
Figure 4. CAL1 Recognizes CENP-A via L1.
(A) Schematic of mel CENP-A construct with bip L1 substituted into the mel HFD (mel GFP-CENP-AbipL1). Blue represents the mel CENP-A protein sequence; bip CENP-A amino acids are indicated in purple.
(B) Western blots of whole-cell extracts showing the expression levels and size of GFP-mel CENP-AbipL1 chimera compared with GFP-mel CENP-A and GFP-bip CENP-A. Top: anti-GFP; bottom: anti-lamin (loading control).
(C) IF images of metaphase spreads from S2 cells transiently expressing GFP-mel CENP-AbipL1 chimera alone, or co-expressed with bip CAL1. DAPI is shown in gray, GFP in green, and mel CENP-A in red. White arrowheads indicate position of the centromere. n = 9 for mel CENP-AbipL1 chimera alone and n = 10 for mel CENP-AbipL1 chimera with bip CAL1. The percentage of cells with centromeric GFP signal is as indicated in the middle column. ***p < 0.0001; Fisher's two-tailed test of cells with compared with cells without bip CAL1. These data were confirmed by two biological replicates (data not shown).
(D) IF images of interphase S2 cells transiently expressing GFP-mel CENP-AbipL1 chimera alone or co-expressed with bip CAL1. DAPI is shown in gray, GFP in green, and mel CENP-A in red. Zoomed panels show representative centromeres with merged colors.
(E) Quantification of the IF shown in D. GFP-CENP-AbipL1 chimera localization was classified as centromeric (gray bars), diffuse (red), or centromeric and diffuse (orange). n = 70 cells quantified for mel CENP-AbipL1 chimera and 83 for mel CENP-AbipL1 chimera with bip CAL1. Error bars denote the SD of three biological replicates. ***p < 0.0001; Fisher's two-tailed test comparing cells with and without bip CAL1.
(F) Schematic of bip CENP-A construct with mel L1 substituted into the HFD (bip CENP-AmelL1; HA-tagged). mel CENP-A residues are represented in blue and bip CENP-A amino acids in purple. HFDs here and in (A) are shown in darker shades of the respective colors.
(G) Western blots of whole-cell extracts showing the expression levels and of the bip HA-CENP-AmelL1 chimera compared with mel HA-CENP-A and bip HA-CENP-A. Top: anti-HA; bottom: anti-lamin (loading control).
(H) IF images of metaphase chromosome spreads from mel lacO S2 cells transiently expressing mel CAL1-GFP-LacI (green) and HA-tagged bip CENP-A or bip CENP-AmelL1 chimera (aqua). Endogenous mel CENP-A is shown in red, DAPI in gray. Yellow arrowheads indicate the position lacO array. n = 20 for HA-tagged bip CENP-A and 16 for HA bip CENP-AmelL1 chimera. The recruitment efficiency to the lacO site for each HA-tagged construct is indicated at the bottom of the HA panel. ***p < 0.0001; Fisher's two-tailed test. These results were confirmed by two biological replicates (data not shown).

