
Figure 5.
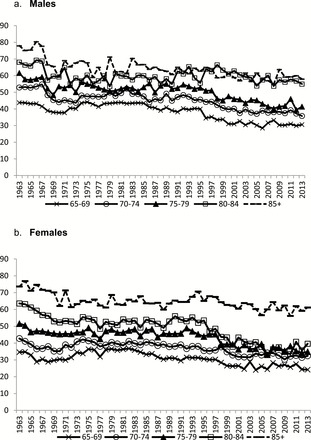
Trend in less severe disability among Americans aged 65 and older: Percent with any activity limitation (1963–2010) for (A) Males and (B) Females. Source: Minnesota Population Center and State Health Access Data Assistance Center, Integrated Health Interview Series: Version 5.0. Minneapolis: University of Minnesota, 2012. http://www.ihis.us. Trends adjusted for changes in question wording.