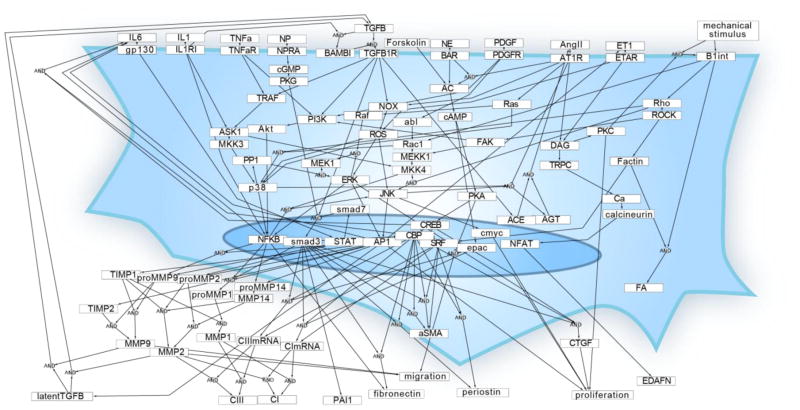
Fig. 1. Reconstruction of the cardiac fibroblast signaling network.
Each of the 91 nodes represents a gene product, modification of a gene product, or cell process in the model. Each arrow indicates a reaction based on experimental data of activation or inhibition from cardiac fibroblasts or a fibroblast-related cell line (142 reactions from 177 papers). Where shown, some reactions combine the influence of multiple reactants via AND gate logic. Multiple reactions affecting the same product are combined using OR gate logic.

