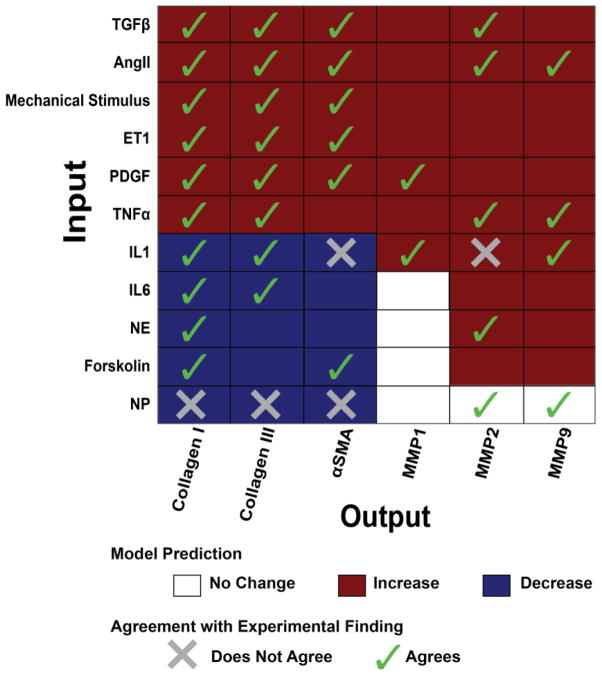
Fig. 3. Validation of network input-output relationships predicted by the model.
The qualitative response of selected fibrosis-related outputs is shown in response to each of 11 input stimuli. Agreement or disagreement with independent experimental data when available from the literature is indicated as a check or an X, respectively. The model validates 35 of the 40 (88%) predictions shown in this Figure that have experimental data. Overall, the model validates 66 of 82 comparisons (80%), as shown inFigure S2andDatabase S2.

