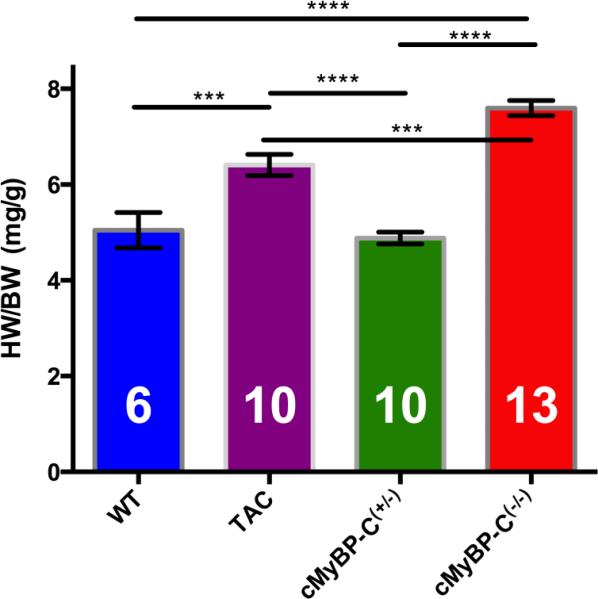
FIGURE 1.
Heart weight to body weight (HW/BW) ratios of WT, TAC, cMyBP-C(−/−) and cMyBP-C(+/−) mouse populations. cMyBP-C(−/−) mice (red) have a significantly increased HW/BW compared to both WT (blue) and cMyBP-C(+/−) mice (green). TAC mice (purple) also exhibited significantly increased HW/BW ratio compared to WT and cMyBP-C(+/−), however this difference didn't appear to be as large as observed in cMyBP-C(−/−) mice. HW/BW ratio was not significantly different between WT and cMyBP-C(+/−). This indicates significant cardiac hypertrophy in cMyBP-C(−/−) and TAC mice. (*** indicates p<0.001, **** indicates p<0.0001, error bars are SEMs). Number of mice used in each measurement inside each column. Note that not all these mice are used in the SRX measurements

