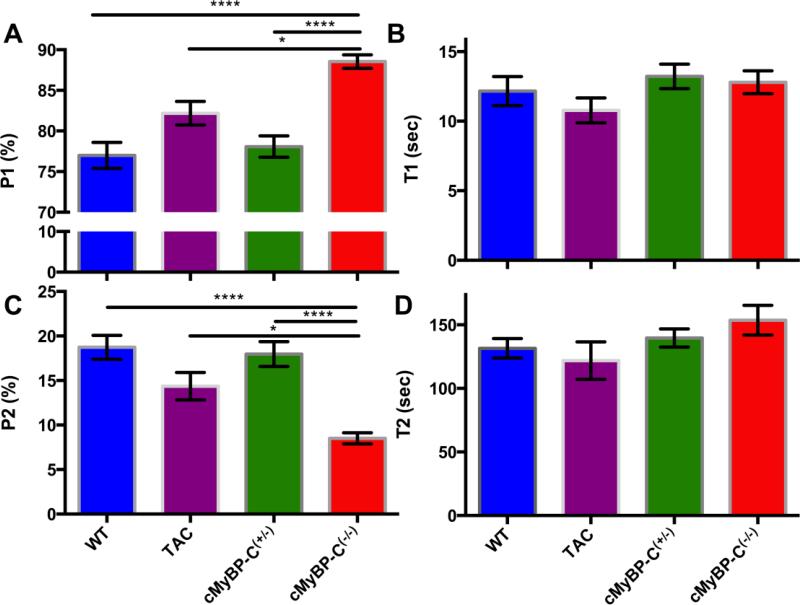
FIGURE 3.
A summary of the parameters derived from the two-state exponential (P1, T1 and P2, T2) in the studied mouse models. The fluorescence decay of the fast component (P1) is increased in cMyBP-C(−/−) mice compared to other models (Panel A). This is coupled to a decrease in the P2 state (Panel C) indicating a shift of myosin heads from the SRX state to the DRX state in the cMyBP-C(−/−) mice. The lifetimes of ATP turnover in both these states remain unchanged (Panels B and D). Data are expressed as mean ± SEM (n=6 for WT, cMyBP(+/−), and cMyBP-C(−/−) and n=3 for TAC; **** indicates p<0.0001, * indicates p < 0.05).

