
Figure 1.
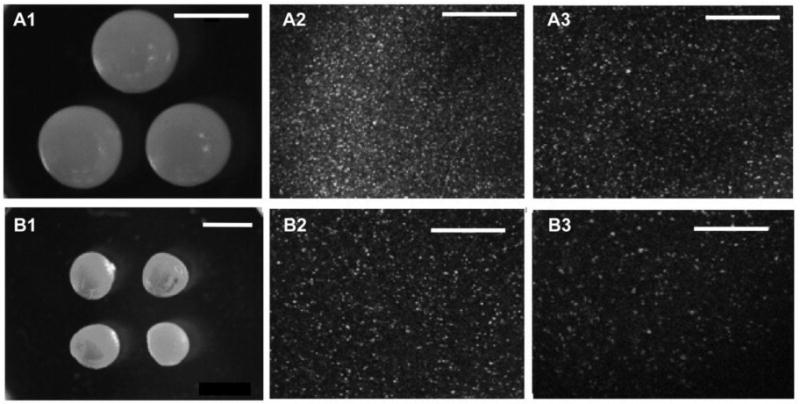
Microphotographs of optical microscopic analysis (A1 and B1) and confocal microscopic images (A2, A3, B2, and B3) of pectin hydrogel beads. Volume of beads: A1–A3, 50 μl; B1–B3, 10 μl. Bacterial content: A1 and B1: 0, A2: 10 Log, A3 and B2: 9 Log, B3: 8 Log. Bar in A1=3 mm, Bar in B1=2 mm, Bar in A2–3 and B2–3=100 μm. Field width: A1=10.5 mm, B1=21 mm, A2, A3, B2, and B3=400 μm.