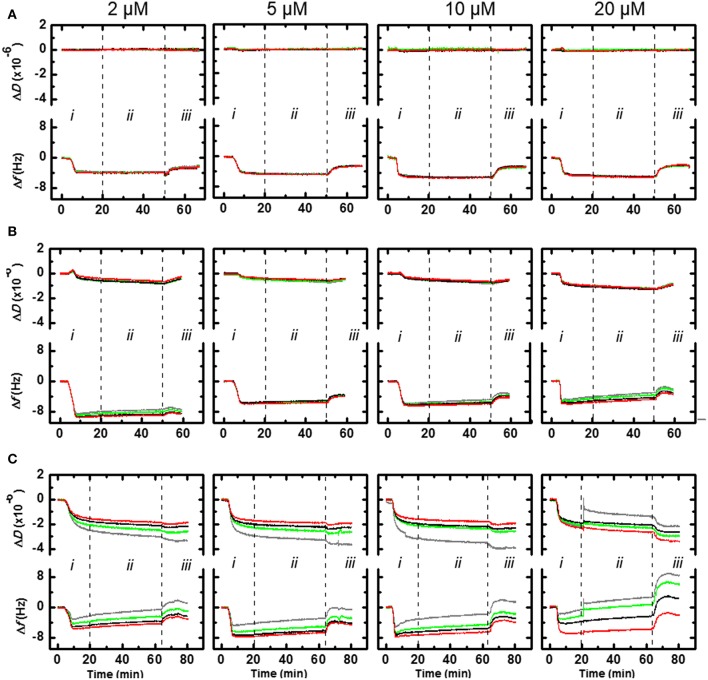
Figure 2.
QCM frequency and dissipation for Api137 (A), Api795 (B), and Api794 (C) acting on surfaces coated with DMPC:DMPG (4:1) as bacterial membrane mimics. Shown are normalized data as ΔD-t and Δf -t graphs of 3rd (gray), 5th (green), 7th (black), and 9th (red) harmonics. Peptides were loaded into a flow cell (period i), incubated (no flow) (period ii), and PBS buffer introduced into the chamber (period iii).

