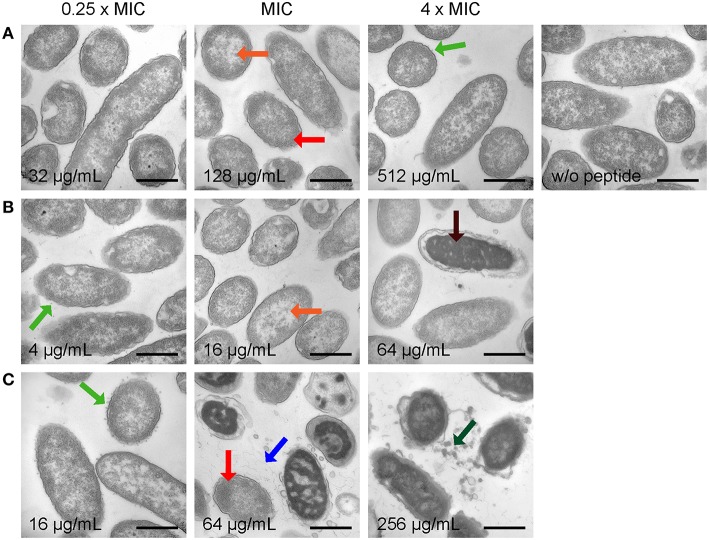
Figure 3.
Electron microscopy images of P. aeruginosa DSM 1117 incubated with Api137 (A), Api795 (B), and Api794 (C) at concentrations corresponding to 0.25 × MIC, MIC, and 4 × MIC for 1 h using cell densities of 5 × 10⁸ CFU/mL. Black bars represent 500 nm. Morphological changes are indicated with arrows: dissociated fragments (blue), small vesicle release (green), large vesicle release (dark green), relocalized DNA (orange), slightly clustered ribosomes (red), and extremely clustered ribosomes (dark red).

