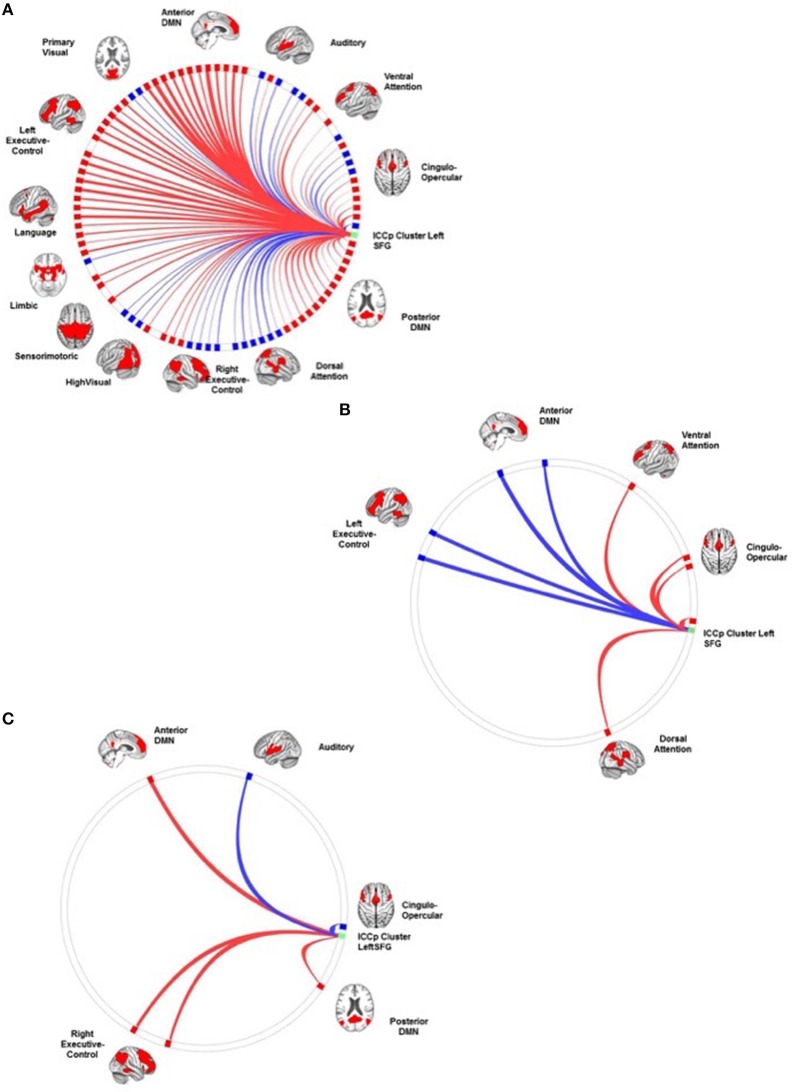
Figure 5.
The connection profiles of the ICCp cluster in the left superior frontal gyrus. The Panel (A) shows the general connection profile of the ICCp cluster located in the left superior frontal gyrus [p < 0.05 FDR corrected (two-sided)]. The blue color indicates negative connections; the red color indicates positive connections. The Panel (B) highlights the connections and corresponding target ROIs showing a significant reduction of strength with increasing age [p < 0.05 FDR corrected (two-sided)]. The blue color indicates negative correlations of the connection strength with age; the red color indicates positive correlations of the connection strength with age. The Panel (C) emphasizes the connections and corresponding target ROIs essential for successful performance in the Corsi Block Tapping Test [p < 0.05 FDR corrected (two-sided)]. The red color indicates positive correlations of connection strength with the Corsi Block Tapping Test. The reader can download a more detailed, high resolution version of these figures as a supplement document from http://journal.frontiersin.org/article/10.3389/fnagi.2016.00086/abstract.

