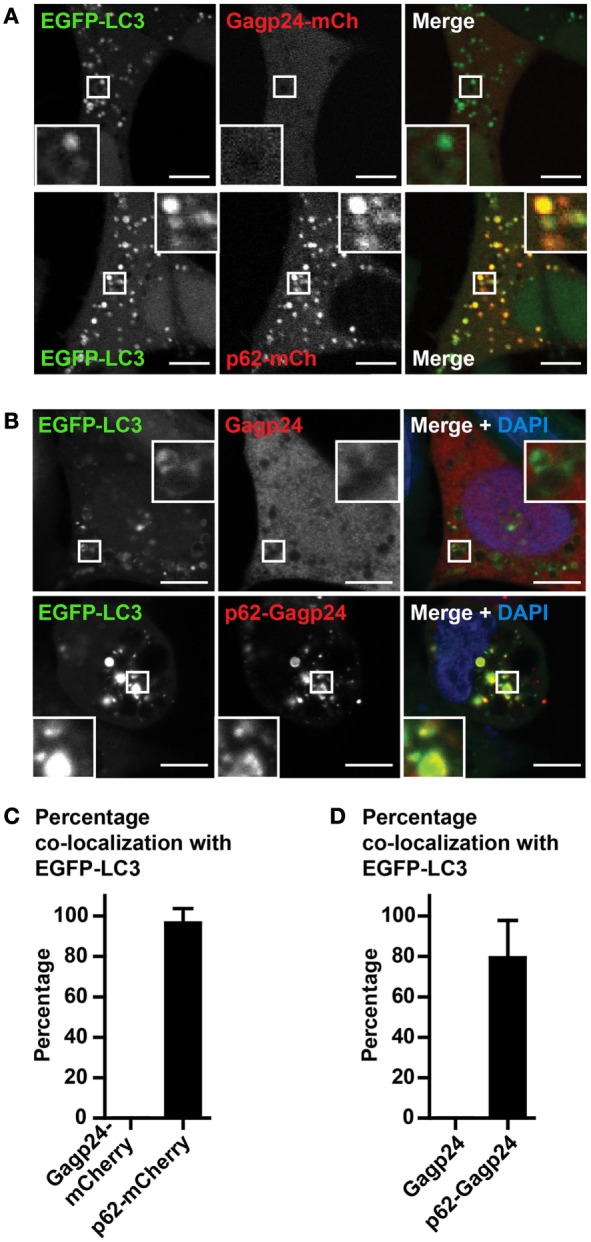
Figure 2.

Gagp24 distributes throughout the cellular cytoplasm. (A) EGFP–LC3+ HEK293 cells were transfected with DNA plasmids encoding Gagp24–mCherry or p62–mCherry. After 20 h, 10 mM NH4Cl was added to the wells in order to prevent acidification of vesicles and retain the EGFP fluorescent signal. The cells were incubated for additional 24 h before analysis by live-cell confocal microscopy. The corner insets show high magnification of framed areas. Scale bars, 5 μm. Images are representative selections from three independent experiments. (B) DNA encoding Gagp24 or p62–Gagp24 was transfected into EGFP–LC3+ HEK293 cells. After 20 h, 10 mM NH4Cl was added to the wells and incubated for additional 24 h before fixation and staining with anti-Gagp24 antibody. The corner insets show high magnification of framed areas. Scale bars, 10 μm. Images are representative selections from three independent experiments. (C) Quantification of double-positive puncta per cell for EGFP–LC3 and Gagp24–mCherry as well as EGFP–LC3 and p62–mCherry in the experiment outlined in (A). Mean values with SEM of three independent experiments are presented. (D) Quantification of double-positive puncta for EGFP–LC3 and Gagp24 as well as EGFP–LC3 and p62–Gagp24 per cell in the experiments outlined in (B): 79% of the p62–Gagp24 puncta were positive for LC3 in NH4Cl-treated cells. Mean values with SEM of three independent experiments are presented.
