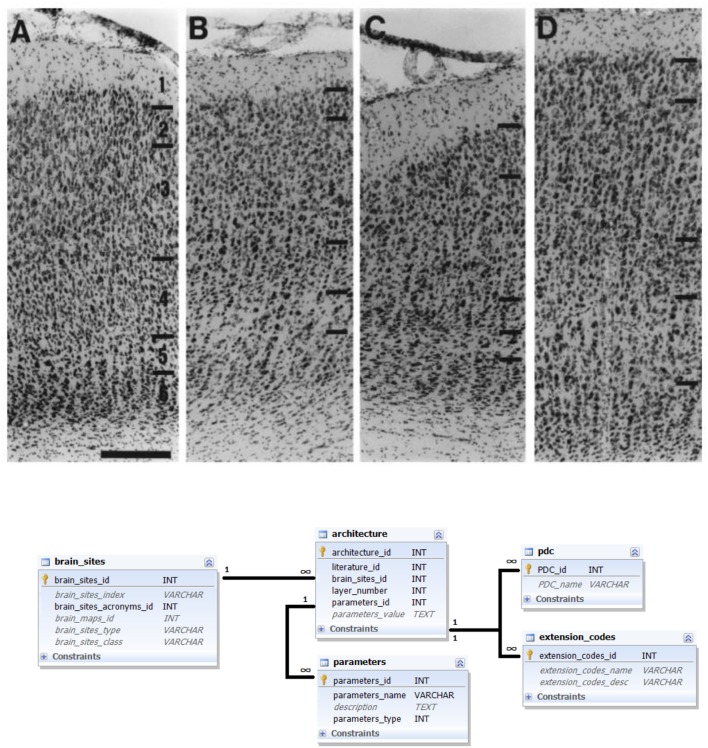
FIGURE 4.
Architecture data and its representation in the database. Upper panel: Example of a literature report on brain architecture data. Photomicrograph of stained sections of several brain areas (from left to right: areas 17, 18, 19, and 21) with indicated laminar subdivisions and 200 μm scale bar (Innocenti et al., 2002); reproduced with permission. A corresponding textual description reads: “Area 17. In Nissl stains […], layers are easily delineated. Layer 2 consists of small, round cell bodies, more densely packed than in layer 3, which is characterized by both small and medium- sized pyramidal cells. Layer 4 is thick and can be subdivided into 4a and 4b, characterized by large granule cells, and 4c, which is thinner and consists of smaller granule cells. Layer 5 has the lowest cell density and contains large pyramidal neurons. In layer 6 the cell density increases again and the neurons are organized in distinct, radially oriented palisades, 2–3 cell bodies thick” (Innocenti et al., 2002). Bottom panel: Ferretome.org database schema related to architecture data modality. The central entity of this schema is the architecture table (linked to a literature table and brain sites table). Architecture can be represented with several parameters and every parameter is supplied with extension and PDC codes.

