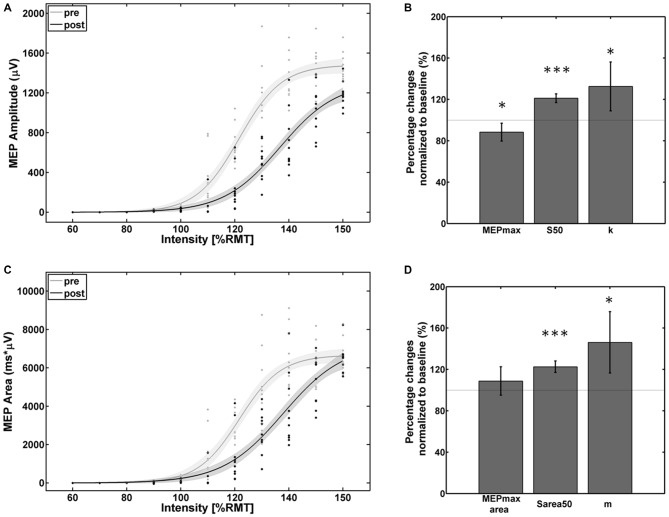
Figure 4.
Empirical data (dots represent single pulses) and Boltzmann fit (lines) of (A,B) the mean MEP SRCs (in μV) and (C,D) the area under the MEP curve (in μV*ms) for pre-intervention (gray) and post-intervention (black) for the subject with decreased cortico-spinal excitability. Each Boltzmann curve is paralleled by thin lines running above/below it that indicate the respective 95% confidence intervals. *p < 0.05, ***p < 0.001.

