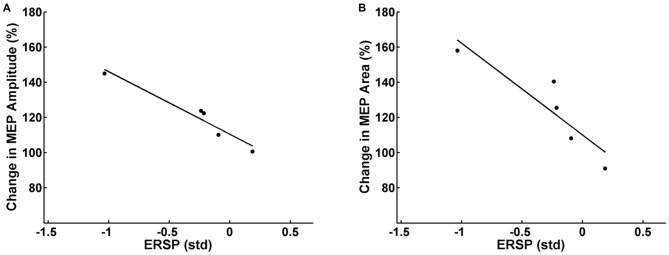
Figure 5.
Relation between the event-related spectral perturbation (ERSP) of the feedback frequency (16–22 Hz) during the task calculated in standard deviations (std) and the MEP peak-to-peak amplitude (A) and area under the curve (B) after the task. Each dot represents the mean MEP and ERSP of one subject. Subjects who achieved on average more event-related desynchronization (ERD) during the task had higher average MEP amplitudes/MEP areas after the intervention.

