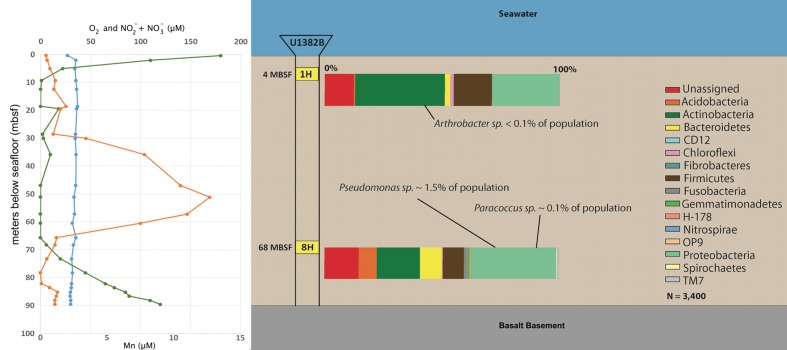
FIGURE 3.
Down-core O2 (green), Mn (orange), and NO3 + NO2 (blue) concentrations (from Expedition Expedition 336 Scientists, 2012 and Orcutt et al., 2013) and 16S rRNA gene taxonomic profile, by phyla, for bacteria in frozen sediments of sections 1H (4 mbsf) and 8H (68 mbsf). Each amplicon sample was rarified to 3400 sequences for analysis. Notations regarding the percentage of isolate signatures are listed (Table 2).

