
Figure 5.
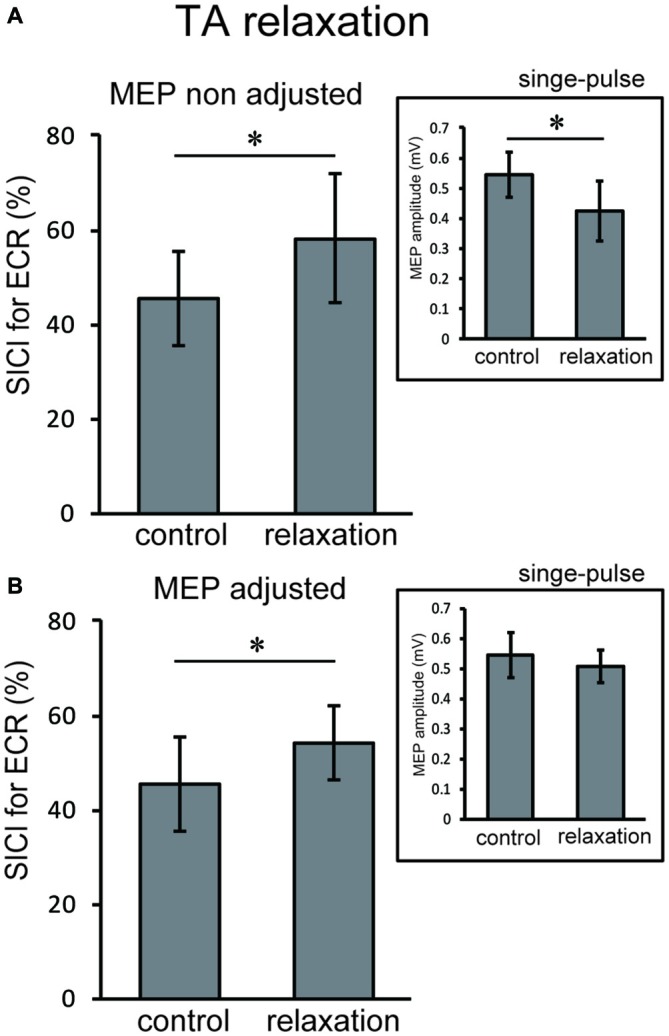
Using the original test pulse, the SICI after TA relaxation was significantly larger (A). However, the test MEP was smaller than the control, in correspondence with the results of Experiment 1 (A, inset). When the MEP amplitudes were adjusted (B, inset), the SICI after TA relaxation (54.00 ± 6.75) was also larger. Error bars indicate SD. Asterisks show statistically significant differences (p < 0.05).