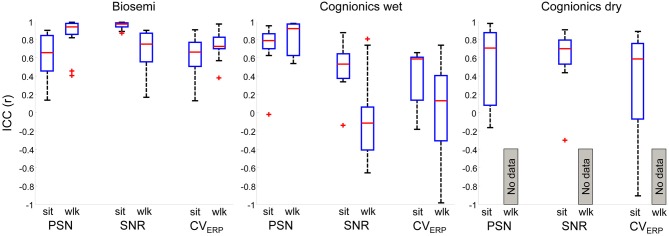
Figure 8.
Boxplots representing Intra class correlation coefficient (ICC) of 12 electrode locations for PSN, SNR and EEG variance (CVERP) in seated (sit) and walking (wlk) conditions. Data was recorded from Biosemi (left panel), Cognionics wet (central panel) and Cognionics dry (right panel). No data from Cdry walking was included as the 75 μV amplitude threshold removed all epochs for this system and condition. For each panel, data from all 12 electrode locations were included in the boxplots. In each plot the central red mark is the median, the edges of the box the 25th and 75th percentiles. The whiskers cover approx. 99% of the data. +denotes ICC values outside the box limits.

