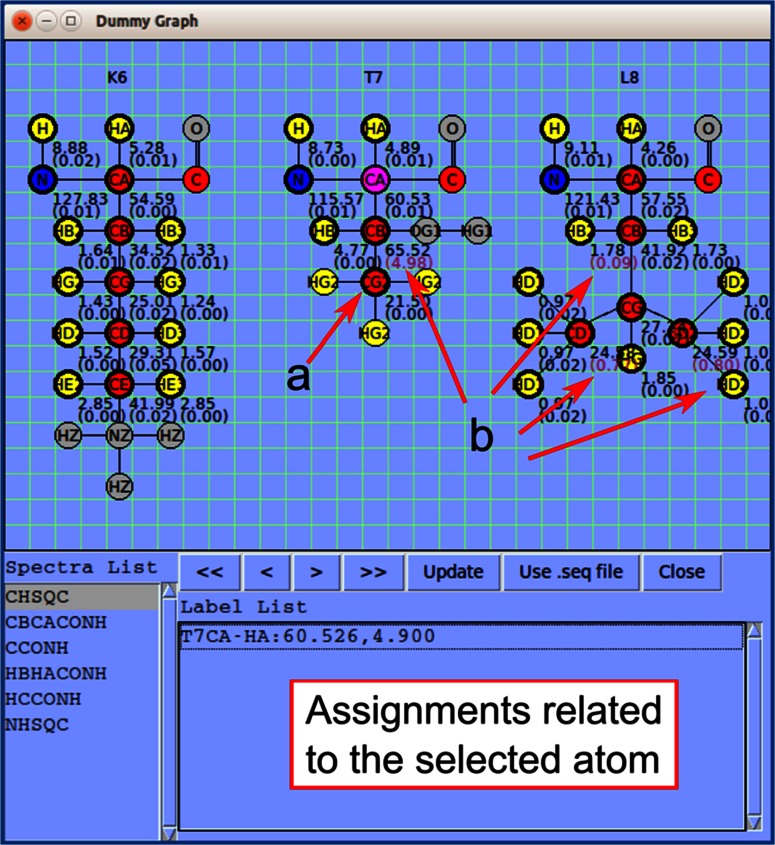
Fig. 4.
Dummy Graph is molecular structure visualization tool that shows the atoms in a three-residue stretch and indicates which atoms have been assigned. Also shown is the average chemical shift and standard deviation (in ppm) from the positions of all peaks in the different spectra supporting a given assignment. An atom can be selected by clicking; this turns its background pink as shown for T7CA. The panel at the bottom shows assignments (in the Label List) related to the selected atom from the spectrum selected in the Spectra List. a A thick line around an atom and chemical shift indicates that the atom is already assigned. Otherwise, a thin line around an atom indicates that it is not yet assigned. b Large chemical shift deviations are written in purple to alert the user to the possibility of an erroneous assignment

