FIGURE 3.
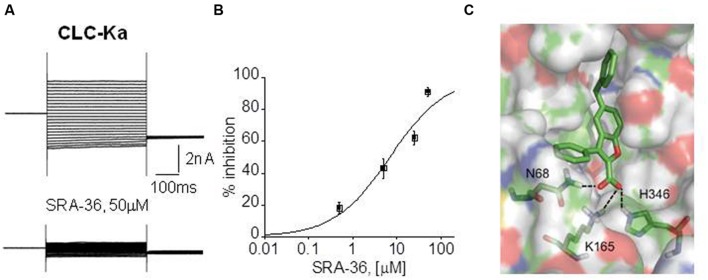
Electrophysiological drug testing on expressed chloride channels and docking simulation. (A) Representative CLC-Ka patch-clamp recordings from transfected HEK293 cells, before and after the application of a synthetic compound, SRA-36. (B) Dose-response curve of CLC-Ka current inhibition by SRA-36 measured at +60 mV. (C) Model of the SRA-36 top-scored docking pose resulting from Induced Fit Docking simulations using a homology model of ClC-Ka modeled on the crystal structure of ClC-ec1.

