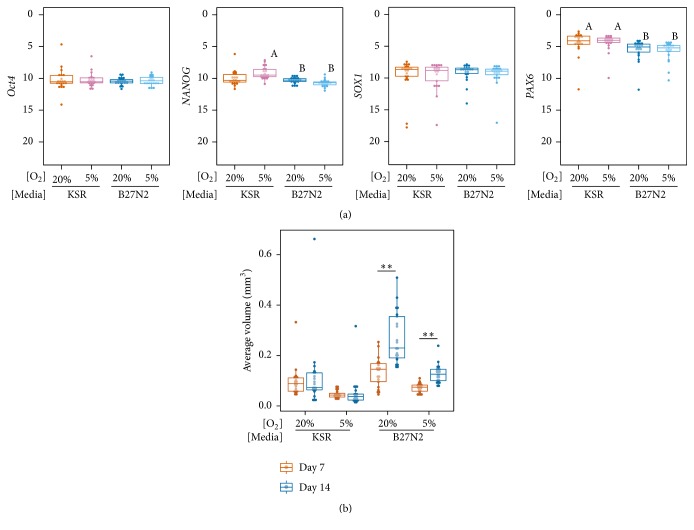
Figure 2.
Effects of media and oxygen level on neural aggregate gene expression and size. (a) Dot plots and box plots showing for the gene expression levels of pluripotency markers (Oct4 and NANOG) and neural markers (SOX1 and PAX6) in day 14 aggregates cultured in the various conditions. Twenty-one clones were analyzed in each condition. Statistical significance was determined by the Steel-Dwass test. Statistically significant differences (p < 0.01) were found between samples “A” and “B”. See also Figure S2. (b) Dot plot and box plot showing the size of day 7 and day 14 neural aggregates. Statistical analysis was performed with the Steel-Dwass test (∗∗ p < 0.01). All p values are shown in Table S2.

