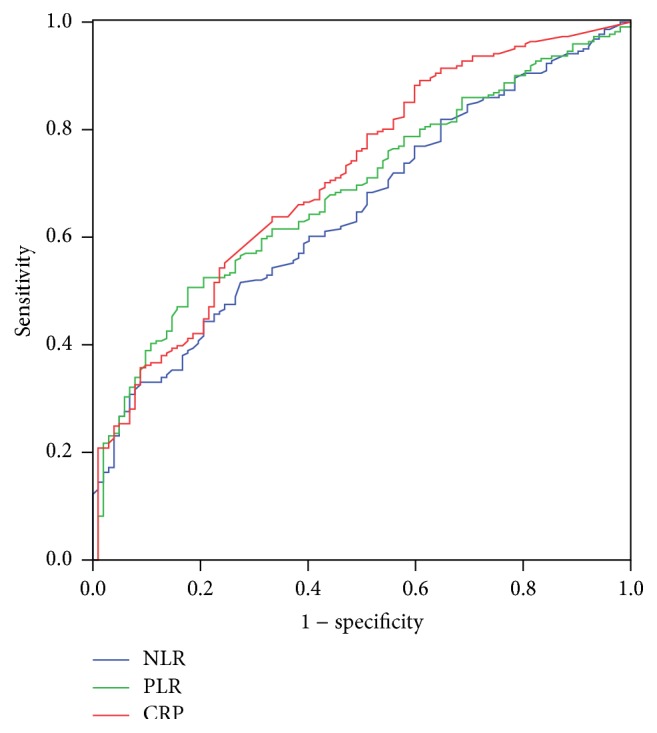
Figure 3.

ROC curves for CSS prediction. The area under the curve (AUC) was 0.713 (95% CI: 0.653–0.772, P < 0.001) for CRP, 0.650 (95% CI: 0.589–0.711, P < 0.001) for NLR, and 0.685 (95% CI: 0.626–0.744, P < 0.001) for PLR.

ROC curves for CSS prediction. The area under the curve (AUC) was 0.713 (95% CI: 0.653–0.772, P < 0.001) for CRP, 0.650 (95% CI: 0.589–0.711, P < 0.001) for NLR, and 0.685 (95% CI: 0.626–0.744, P < 0.001) for PLR.