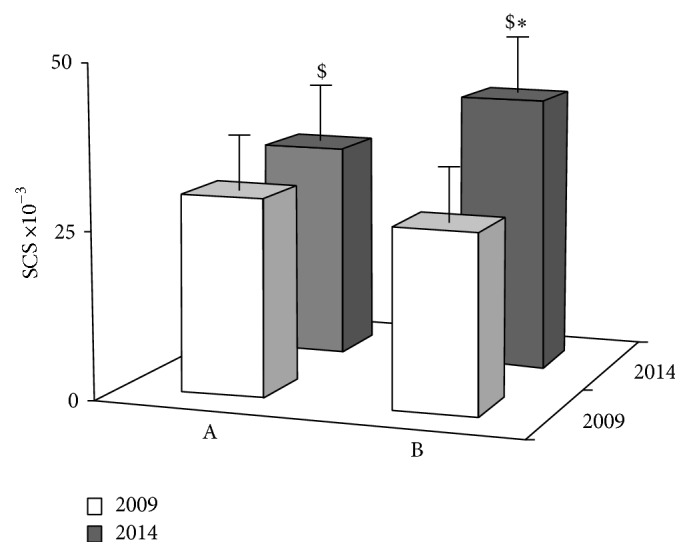
Figure 5.

Variations of SCS after five years of dietary intervention in BC patients that had consumed less than five (A, n = 39) or five (B, n = 32) F/V servings per day. The values are the mean ± SD of duplicate measurements at starting (white bar) and at the end (grey bar) of observation. ($) with respect to the relevant value in 2009, significant with p < 0.0001 (paired t-test). (∗) with respect to A in 2014, significant with p < 0.0001 (unpaired t-test).
