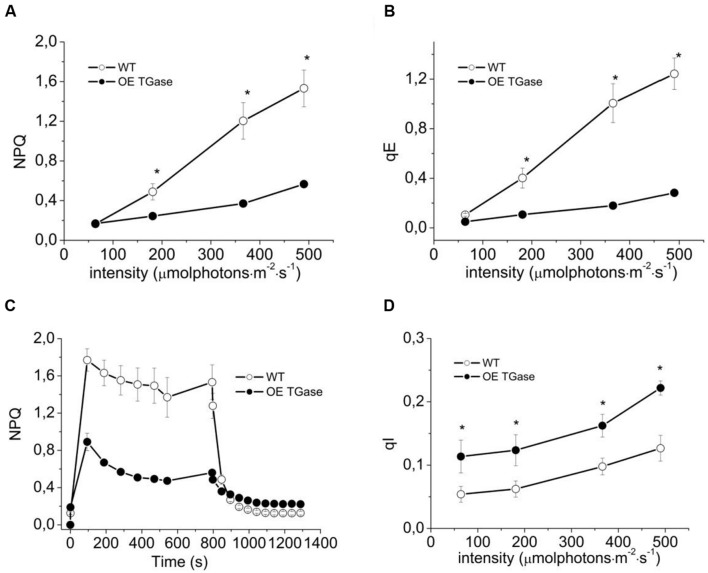
FIGURE 3.
Short term photoprotection mechanisms for intact WT (open symbols) and OE TGase (closed symbols). (A) Non-photochemical quenching in intact plants exposed to four different light intensities. There is lower NPQ for OE TGase, which is more evident at the higher intensity. (B) Energization quenching (qE) in intact plants exposed to four different light intensities. (C) Typical traces of NPQ induction and relaxation kinetics at 490 μmol photons m-2 s-1. (D) Photoinhibition quenching qI under the conditions of A,B. Error bars denote standard error (n = 6) and asterisks statistically significant differences (p < 0.05).

