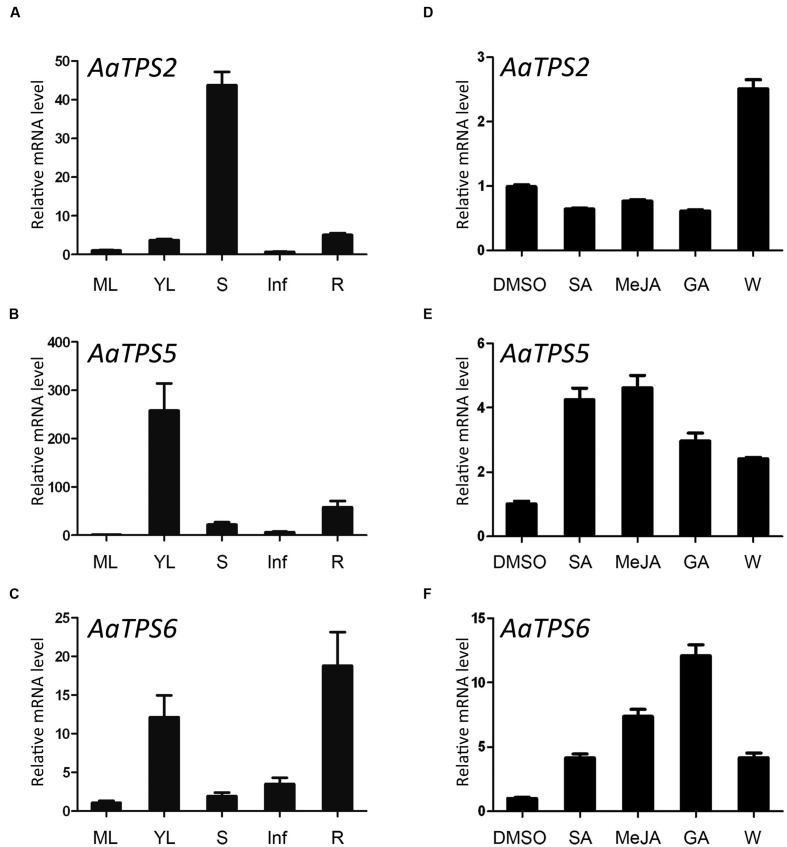
FIGURE 4.
Expression patterns of AaTPS2, AaTPS5, and AaTPS6. The transcripts were analyzed by quantitative real-time RT-PCR, with AaACTIN (EU531837) as internal standard. (A–C), relative transcript levels of AaTPS2, AaTPS5, and AaTPS6 in different organs. ML, mature leaves; YL, young leaves; S, stem; Inf, inflorescence; R, root. (D–F) Relative transcript levels of AaTPS2, AaTPS5, and AaTPS6 after phytohormone treatments [5 mM salicylic acid (SA), 50 μM methyl jasmonate (MeJA), or 100 μM gibberellin (GA)] and mechanical wounding treatment (W) for 4 h. Error bars indicate standard deviation (SD) of three biological replicates.

