Figure 2.
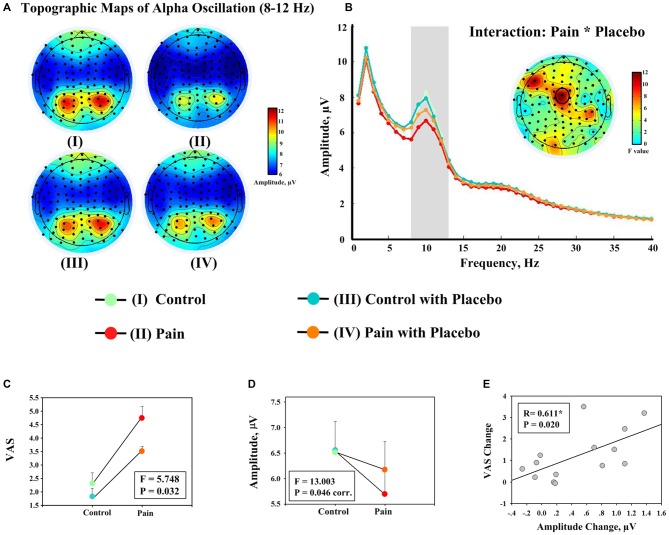
Evidence showing the effect of placebo treatment from behavioral and EEG data. (A) Group level scalp topographies of alpha oscillations (8–12 Hz) of different experimental conditions. (B) Group level spectra (measured at FCz) of different experimental conditions. Scalp topography showing the significant interaction between the factors “pain” and “placebo” on the amplitudes of alpha oscillations at FCz is displayed in the insert. (C) Significant interaction effect between the factors “pain” and “placebo” was observed on the average ratings of pain intensity across all rating points (once every 15 s; left). (D) The amplitudes of alpha oscillation (measured at FCz). Each dot represents the mean value from one condition, and error bars represent, for each condition, ± SEM across subjects (F: F value of the interaction effect between the factors “pain” and “placebo”; corr.: corrected for multiple comparisons). (E) Significant correlation was observed between decrease in pain intensity during noxious stimulation after placebo treatment (II–IV) and the increase in the amplitude of alpha oscillation measured at FCz (IV–II). Each dot represents a value from each subject, and black line represents the best linear fit.

