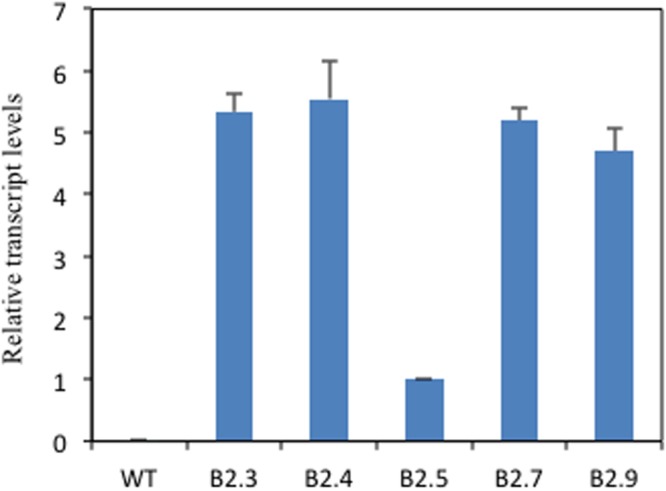
FIGURE 4.

Overcxprcssion of TaB2 in transgenic Arabidopsis plants. Real- lime PCR analysis of WT and TaB2 transgenic Arabidopsis plants, showing the expression in five homozygous transgenic lines (B2.3, B2.4, B2.5, B2.7, and B2.9) with no detectable expression in WT relative to B2.5 line indicating the lowest expression of the transgene. Actin gene was used as an internal control. Data are mean ± SE from two biological and three technical replicates.
