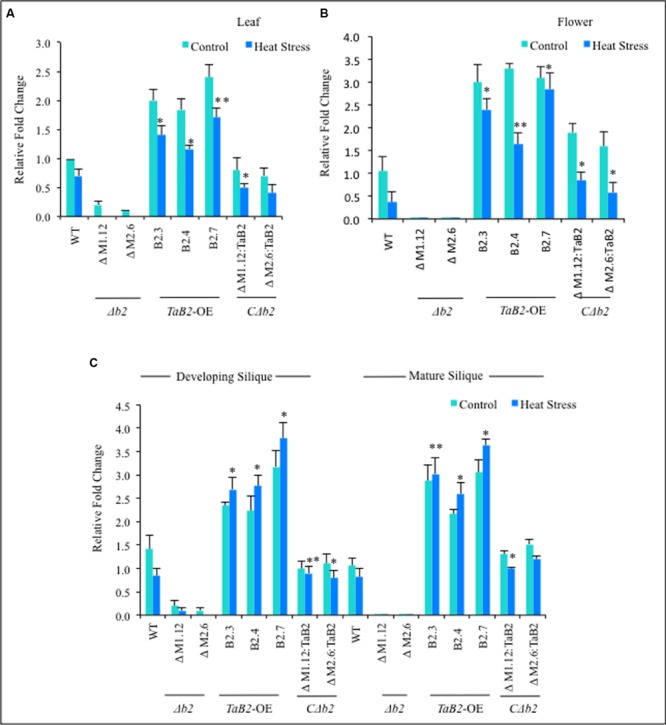
FIGURE 6.

Quantitative RT-PCR was done in different tissues viz. (A) leaf, (B) Flower, (C) developing and mature siliquc of 8-week old Arabidopsis plants of WT, Δb2, TaB2-OE and CΔb2 under control and heat stress conditions. Data represents from three independent replicates and are mean ± SD. Asterisks marked above bars indicate statistically significant differences (∗P ≤ 0.05, ∗∗P ≤ 0.01).
