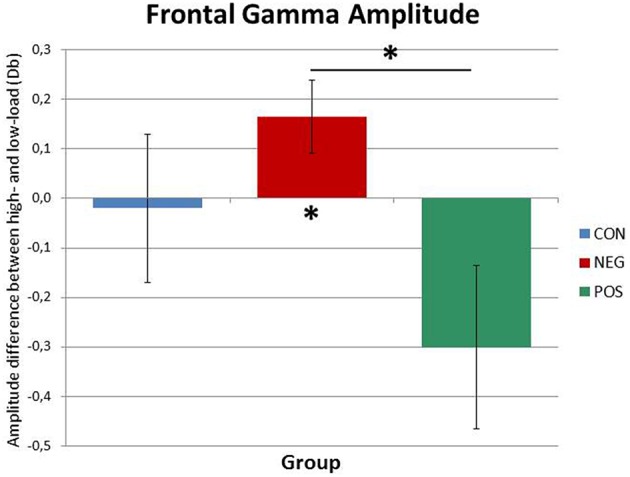
Figure 3.

Frontal gamma amplitude differences between high-load and low-load conditions for the three groups. While the positive symptomatic group shows decreased gamma power in the ACC in the high-load condition, the negative symptomatic group displays a marked increase. The healthy control subjects do not differ from either patient group. Significant differences are indicated by asterisks (p < 0.05).
