Figure 1.
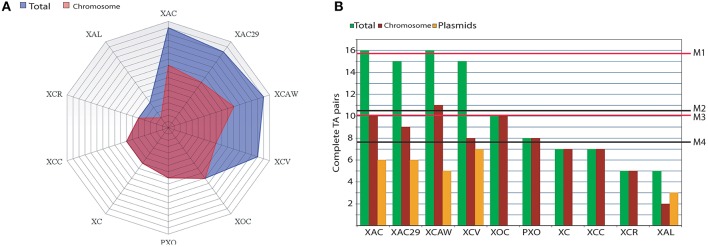
Abundance of TAs in Xanthomonas spp. (A) A radar graph showing the abundance of complete TA systems found in the genomes of the 10 Xanthomonas strains. Each line on the grid represents one TA pair. Blue area represents the totality of TAs in both plasmids and chromosomes while the pink area shows the abundance of TAs on the chromosomes. (B) A bar graph showing the complete TA pairs found in the whole genome (green bars; for each genome); chromosome only (red bars) and plasmids (orange bars). The mean values of TA per genome are M1 = 15.6 (for the Citrus-infecting strains XAC, XAC29, and XCAW) and M2 = 10.4 (accounting the ten strains). The mean values for TAs per chromosome (i.e., excluding plasmids TAs) are M3 = 10 (only Citrus-infecting strains XAC, XAC29, and XCAW) and M4 = 7.7 (for the 10 chromosomes). XAC (Xanthomonas citri subsp. citri 306); XAC29 (Xanthomonas axonopodis Xac29-1); XCAW (Xanthomonas citri subsp. citri Aw12869); XCV (Xanthomonas campestris pv. vesicatoria 85-10); XOC (Xanthomonas oryzae pv. oryzicola BLS256); PXO (Xanthomonas oryzae pv. oryzae PXO99A); XC (Xanthomonas campestris pv. campestris 8004); XCC (Xanthomonas campestris pv. campestris ATTC33913); XCR (Xanthomonas campestris pv. raphani 756C); XAL (Xanthomonas albilineans GPE PC73).

