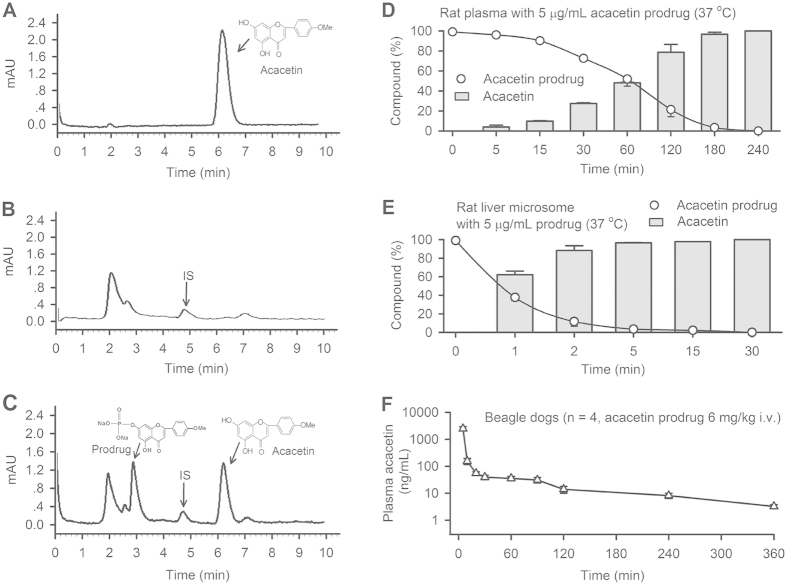
Figure 4. Bioconversion of acacetin prodrug.
(A) HPLC graph of acacetin (1 μg/mL) in mobile phase. (B) HPLC graph of blank rat plasma with 50 ng/mL pentamethylquercetin as an internal standard (IS). (C) HPLC graph of rat plasma containing acacetin prodrug (1 μg/mL) and an IS (50 ng/mL) with 60 min incubation (37 °C). (D) Mean percentage values of acacetin prodrug and acacetin converted from acacetin prodrug in rat plasma (at different time points, n = 3). (E) Mean percentage values of acacetin prodrug and acacetin converted from acacetin prodrug in rat liver microsome (at different time points, n = 3). (F) Mean values of acacetin concentrations in plasma of beagle dogs (n = 4) administered intravenously with 6 mg/kg acacetin prodrug.

