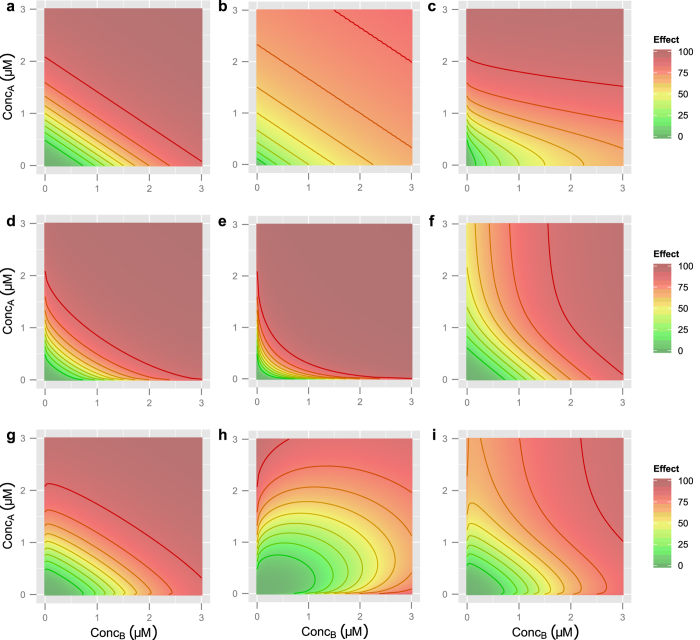
Figure 1. Example BRAID response surfaces.
Unless otherwise specified, in all surfaces, IDM,A = 1.5 μM, IDM,B = 1.5 μM, na = nb = 3, E0 = 0, Ef,A = Ef,B = 100, and κ = 0. Isoboles in all plots represent a change in effect equal to 10. (a) A basic additive response surface. (b) Lower Hill slopes (na = nb = 1). (c) Differing Hill slopes (na = 1, nb = 3). (d) Mild synergy (κ = 0.75). (e) Strong synergy (κ = 2.5). (f) Differing final effects (Ef,A = 100, Ef,B = 55). (g) Mild antagonism (κ = −0.3). (h) Severe antagonism (κ = −1.2). (i) A more complex surface, with na = 2.7, nb = 3.2, Ef,A = 100, Ef,B = 75, and κ = −0.5. Note that the isoboles, particularly at higher effect levels, show regions of convexity and concavity; traditionally, surfaces like this would necessitate varying domains of synergy and antagonism. However, by allowing the maximal effects of the two drugs to differ, such surfaces can be modeled with a single interaction parameter.

