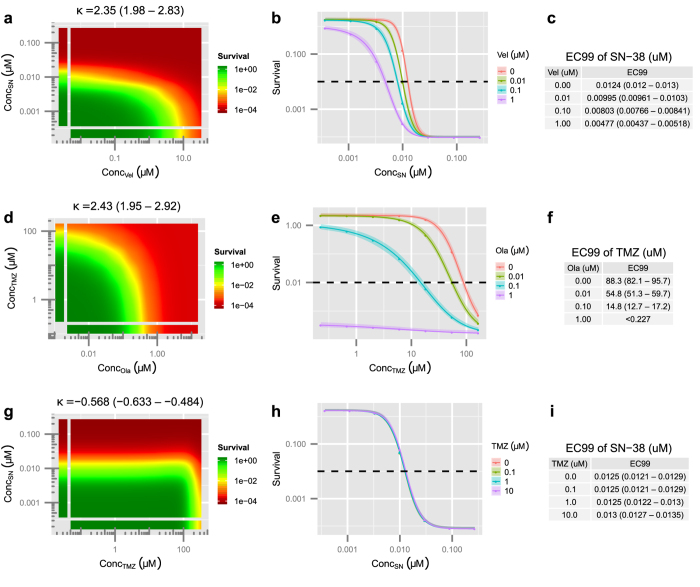
Figure 6. Modeling potentiation.
Calculation of potentiation with the BRAID model for the combinations of veliparib and SN-38 in ES1 (a–c), olaparib and temozolomide in ES8 (d–f), and temozolomide and SN-38 in ES1 (g–i). (a,d,g) Best fit BRAID surface for each combination with estimated value of κ and confidence interval. (b,e,h) Estimated effect of the second drug in each combination in the presence of various levels of the first drug. Curve shifts to the left indicate potentiation. (c,f,i) EC99 values of the second drug in each combination in the presence of various levels of the first drug. Note that though the combinations of veliparib vs SN-38 and olaparib vs. temozolomide exhibit similar κ values, olaparib produces considerably more potentiation of temozolomide than veliparib does of SN-38. This is due both to the increased potency of olaparib and the lower Hill slope of temozolomide.

