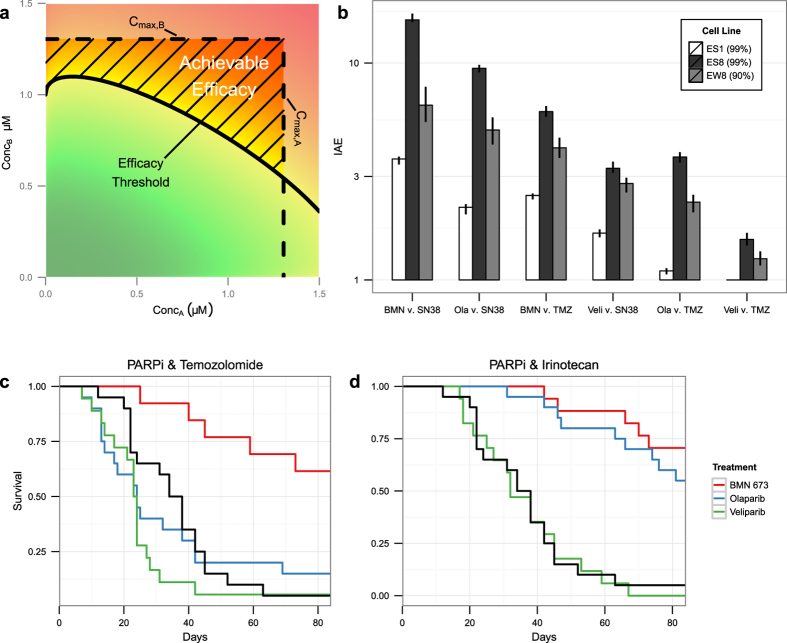
Figure 7. Predictions of the index of achievable efficacy (IAE).
(a) Illustration of the calculation of IAE. The area bounded by the maximum achievable concentrations of both compounds and the isobole of the desired efficacy is the “area of achievable efficacy”. The square root of the ratio of the area of all achievable dose pairs (Cmax,A∙ Cmax,B in this case) to the area of achievable efficacy is the IAE. (b) Measured values of IAE99 in cell lines ES1 and ES8 and IAE90 in cell line EW8 for all PARPi and SOC agent combinations. Black bars indicate bootstrapped confidence intervals on IAE values. (c,d) Survival of mice orthotopically implanted with ES8 cells treated with combinations of all three PARPi with temozolomide (c) and irinotecan (d). Black survival curves indicate the SOC only treatment of irinotecan and temozolomide.

