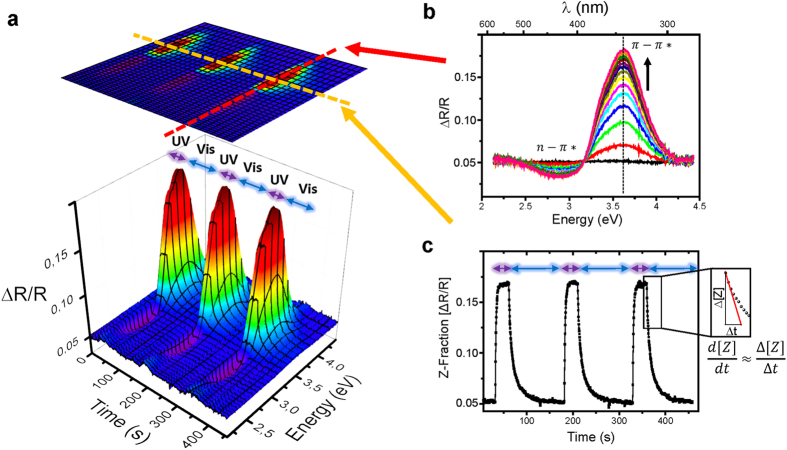
Figure 2. Differential reflectance spectroscopy (DRS) of P1-nanofibers during photoisomerization.
(a) Reversible switching of an azobenzene nanofiber sample is apparent from a 3D graph of the optical differential reflectance during three switching cycles. Cross sections at fixed time as a function of the energy yield DRS spectra (b) and cross sections at 3.5 eV as a function of time allow for determination of the rate of Z → E isomerization (c).

