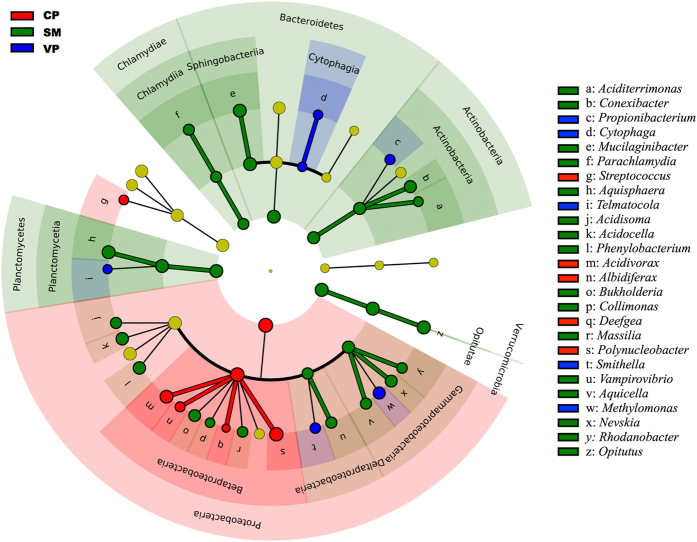
Figure 2. Least discriminant analysis (LDA) effect size taxonomic cladogram, based on 16S rRNA gene sequences, comparing all samples for the three habitats.
Significantly discriminant taxon nodes are coloured and branch areas are shaded according to the highest ranked group for that taxon. If the taxon is not significantly differentially represented among sample habitats, the corresponding node is coloured yellow.

