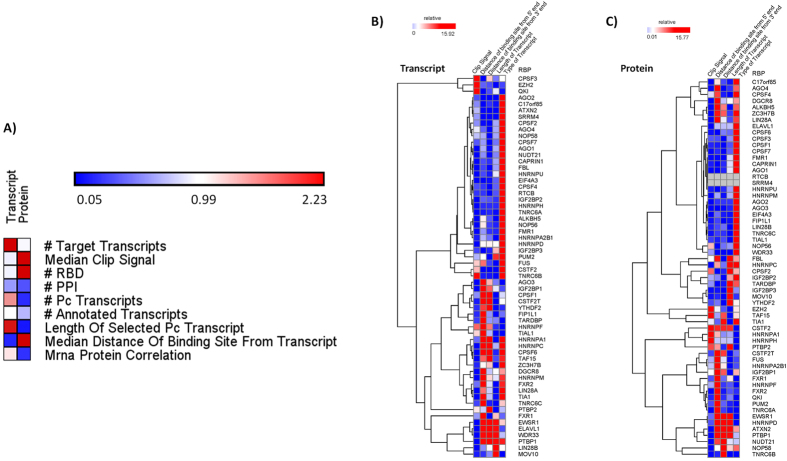
Figure 6. Heatmaps showing the significance of various features influencing correlation at the RBP and transcript centric levels.
Heatmaps show the significance values (−log(p-value)) obtained by performing multivariate regression modelling to predict features influencing correlation at the (A) RBP level. (B,C) Transcript level when RNA and protein levels of RBPs were considered. Significance values for various features considered in this analysis are clustered hierarchically. Similar results were obtained using stepwise linear regression and elastic net regression modelling.

