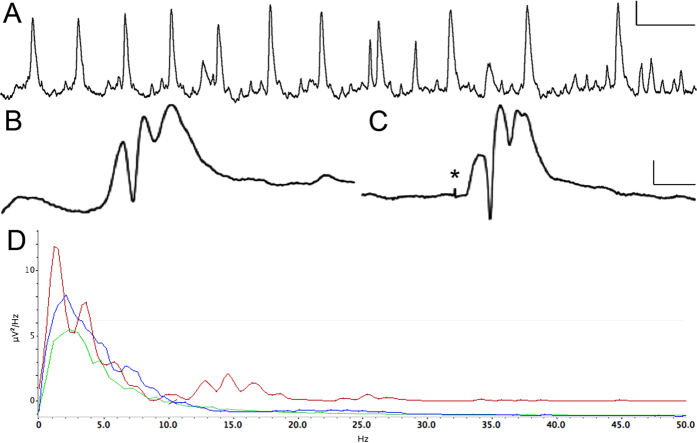
Figure 1. Spontaneous electrographic events recorded from the dentate gyrus in a freely-moving rat during the latent period following 8 hours of perforant pathway stimulation.
(A) Twelve seconds of activity, demonstrating low frequency oscillations (LFOs) at a rate of 1 per second, with a frequency of 13.0 Hz. (B) Spontaneous unilateral EPSP with population spikes recorded from the granule cell layer. (C) Waveform evoked by 7.8 V perforant pathway stimulation. Note the high degree of similarity to panel B. All responses were obtained from the same rat three days post-stimulation. (D) Power Spectrum Density plot showing two minutes of LFOs (red), two minutes of baseline EEG in the same rat (blue), and two minutes of baseline EEG in non-epileptic control (green). Note the greater Power at 1 Hz and from 10–20 Hz, corresponding to the rate and frequency of LFO waveforms (red trace). Calibration bars = 1 s, 10 mV in A; 10 ms, 10 mV in B and C; 10 kHz sampling rate.

