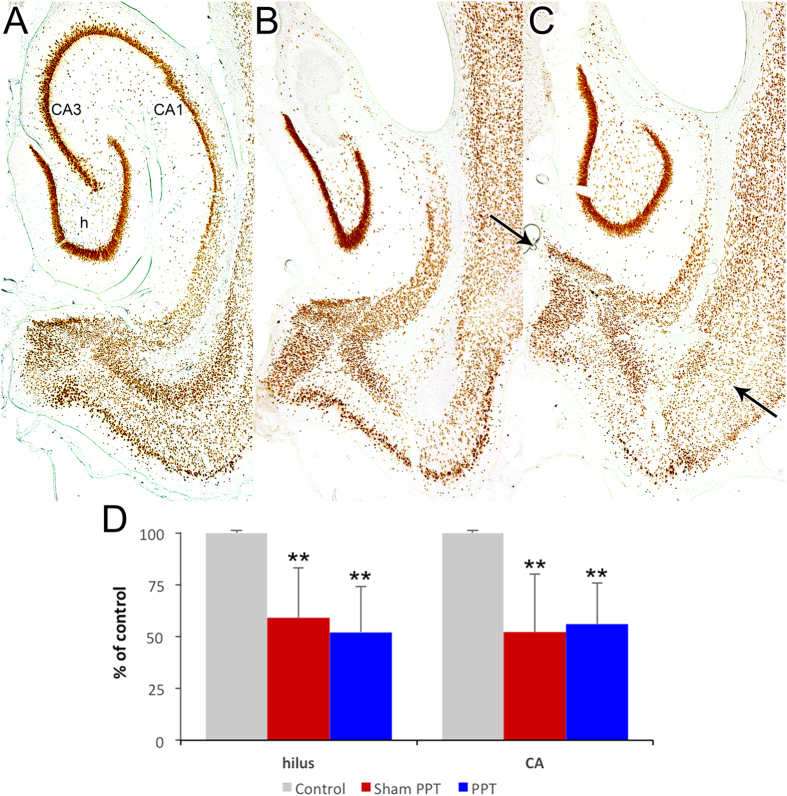
Figure 5. Hippocampal neuropathology ca.
2 months after 8 h perforant pathway stimulation in control (A), sham perforant pathway transection (Sham PPT, (B), and PPT (C) groups. NeuN-immunostained transverse sections demonstrating similar neuron loss in both experimental groups. Note the severe loss of CA3 and CA1 neurons in the hippocampus. Arrows in panel C denote the location of the mechanical lesion. (D) Quantification of hippocampal neuron loss. Neuron counts were performed on matching NeuN-immunostained sections. CA3 and CA1 were combined as the border between these regions was unclear in experimental animals. Although substantial neuron loss was seen in the hilus (h) and CA regions in both Sham PPT and PPT groups when compared with control (n = 5 per group, p < 0.001), there was no significant difference between groups (p > 0.05), demonstrating no effect of PPT on neurodegeneration.

