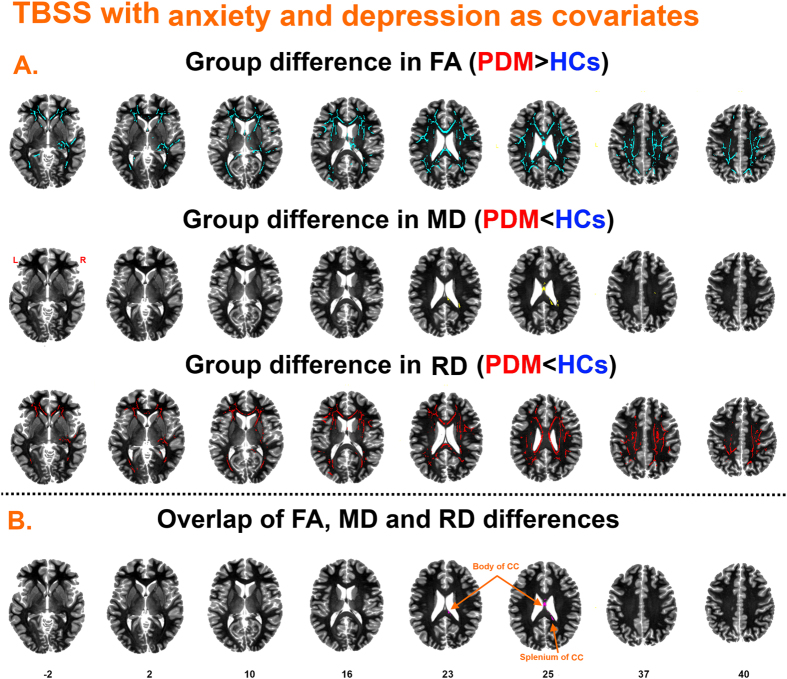
Figure 3. TBSS findings with self-rating anxiety scale (SAS) and self-rating depression scale (SDS) as covariates.
(A) Regions showing increased FA (Fig. 3A first row), decreased MD (Fig. 3A second row) and decreased RD (Fig. 3A third row) in PDM patients compared to healthy controls. (B) Overlapping regions including the body and splenium of corpus callosum (CC).

