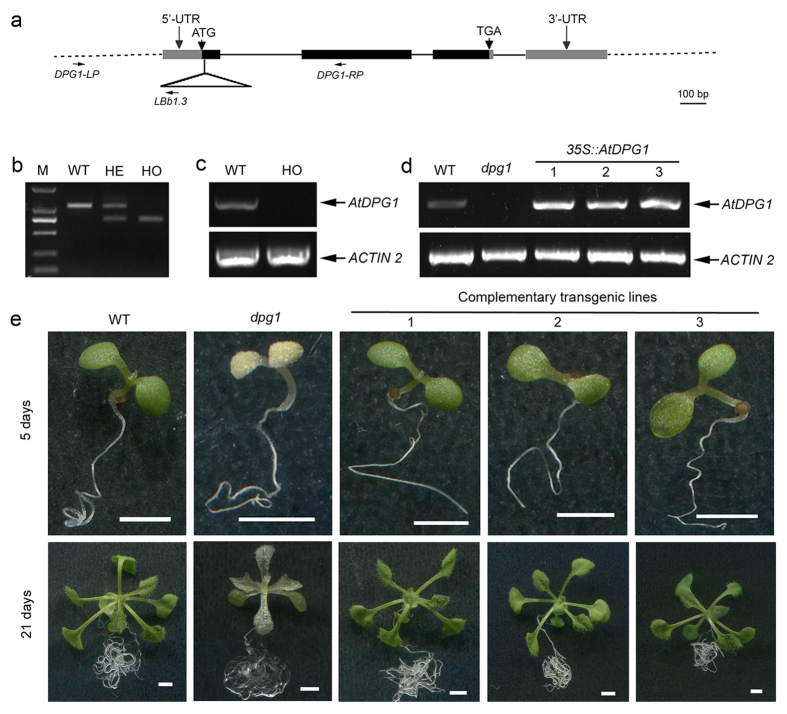
Figure 2. Molecular identification and phenotype rescue of the dpg1 mutant.
(a) Gene structure of At1g49510 and the position of the T-DNA insertion. Exons and introns are represented by boxes and lines, respectively. The insertion site of the T-DNA in dpg1 is indicated by a triangle. DPG1-LP, DPG1-RP and LBb1.3 are the primers that were used for genotyping PCR. (b) A representative genotyping PCR result of dpg1. Offspring of the heterozygous dpg1 were segregated into three genotypes: wild type (WT), heterozygous (HE) and homozygous (HO). (c) Semi-quantitative RT-PCR analysis of AtDPG1 in the wild type (WT) and homozygous dpg1 mutant (HO). The ACTIN2 gene was used as an internal control. (d) Semi-quantitative RT-PCR analysis of the AtDPG1 transcription levels in the wild type (WT), the homozygous dpg1 and three complementary transgenic lines (Lines 1, 2 and 3). The ACTIN2 gene was used as an internal control. (e) The phenotype of a dpg1 homozygous plant was rescued by transformation with a 35S::AtDPG1 transgene. Scale bar = 2 mm.

