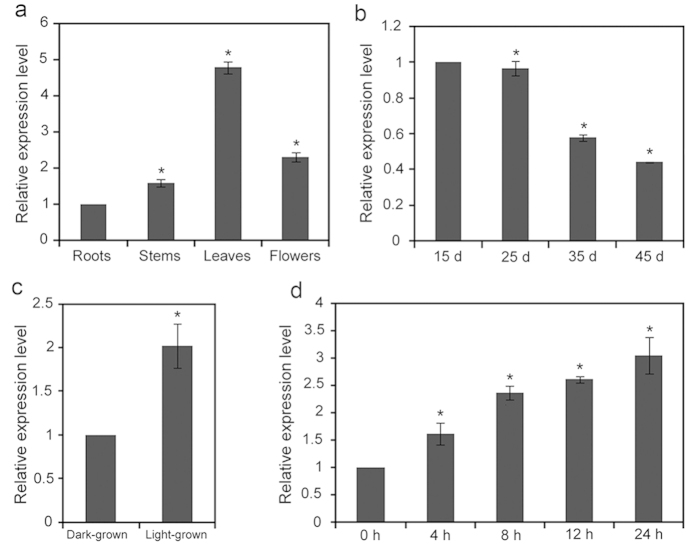
Figure 6. Expression pattern of the AtDPG1 gene.
(a) Quantitative real-time PCR analysis of AtDPG1 transcripts in different organs (roots, stems, leaves, and flowers) from 45-day-old wild-type Arabidopsis plants. The expression levels of AtDPG1 displayed a range of cycle Ct values ranging from 22.80 to 24.44 in different tissues. The roots expressed the lowest levels of AtDPG1 mRNA, with a Ct value of 24.44, and the AtDPG1 transcript level in roots was set to 1.0. (b) AtDPG1 transcript levels in the leaves of different developmental stages in wild-type Arabidopsis plants. The AtDPG1 transcript level in the leaves from 15-d-old seedlings was set to 1.0. (c) Transcript levels of AtDPG1 in 4-day-old wild-type light-grown and dark-grown seedlings. The AtDPG1 transcript level in the dark-grown seedlings was set to 1.0. (d) Transcript levels of AtDPG1 during the light-induced greening of etiolated wild-type seedlings. After growth in darkness for 4 days, the etiolated Arabidopsis seedlings were illuminated for 4, 8, 12, and 24 h. The AtDPG1 transcript level in the etiolated seedlings was set to 1.0. The bar graphs show the relative expression levels, as determined by the comparative CT method and normalized to the expression of the ACTIN2 gene. The error bars indicate the interval delimited by 2−(ΔΔCT ± SD). The asterisks indicate ΔCT values significantly different from those of the control in a Mann–Whitney U-test (P < 0.05).

